Review
. 2014 Oct;46(10):1891-9.
doi: 10.1249/MSS.0000000000000325.

Heat waves, aging, and human cardiovascular health

Affiliations
Review

Heat waves, aging, and human cardiovascular health

W Larry Kenney et al. Med Sci Sports Exerc. 2014 Oct.

Abstract

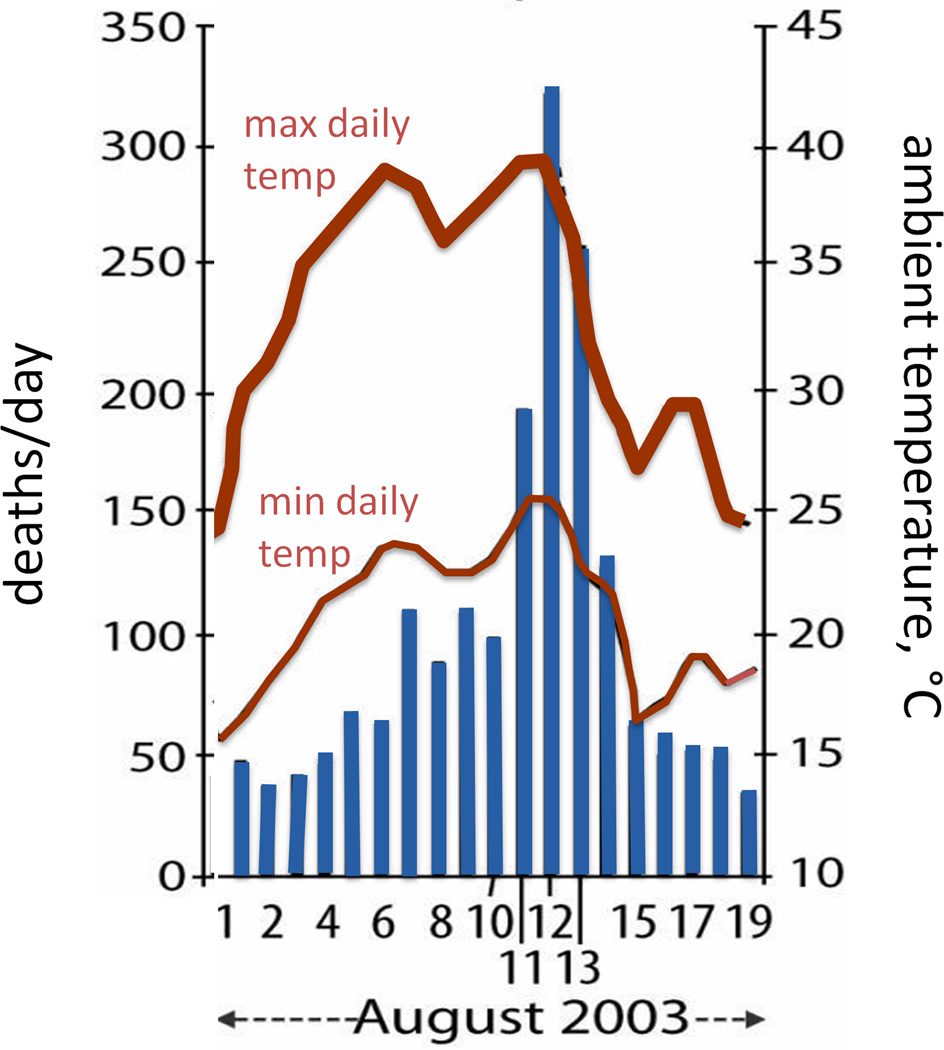
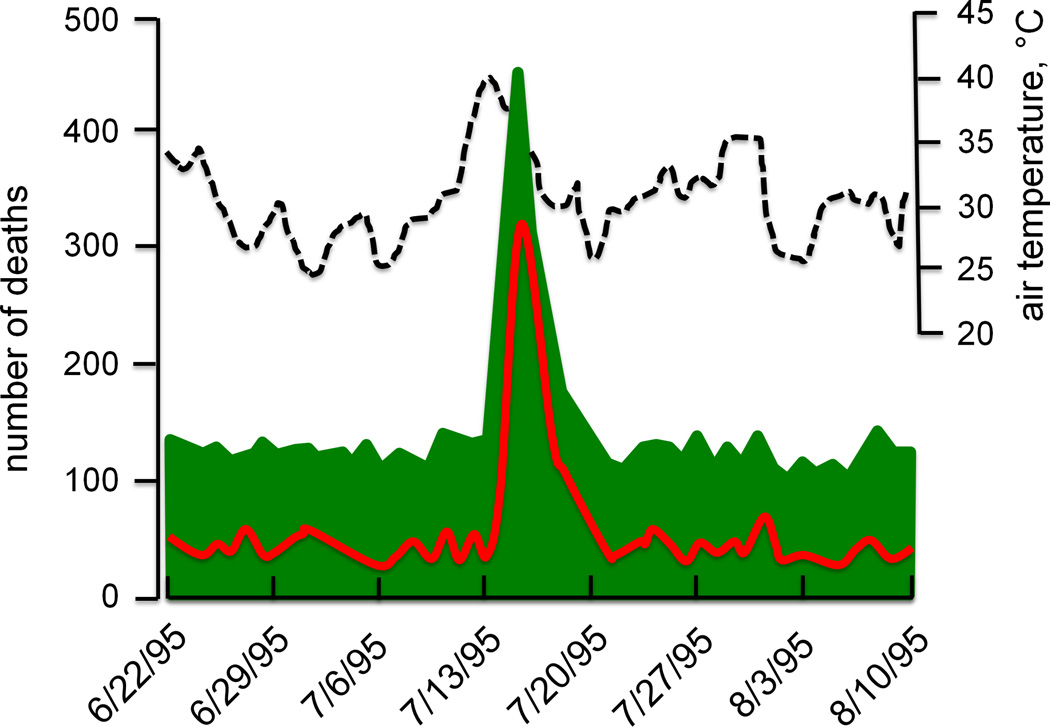
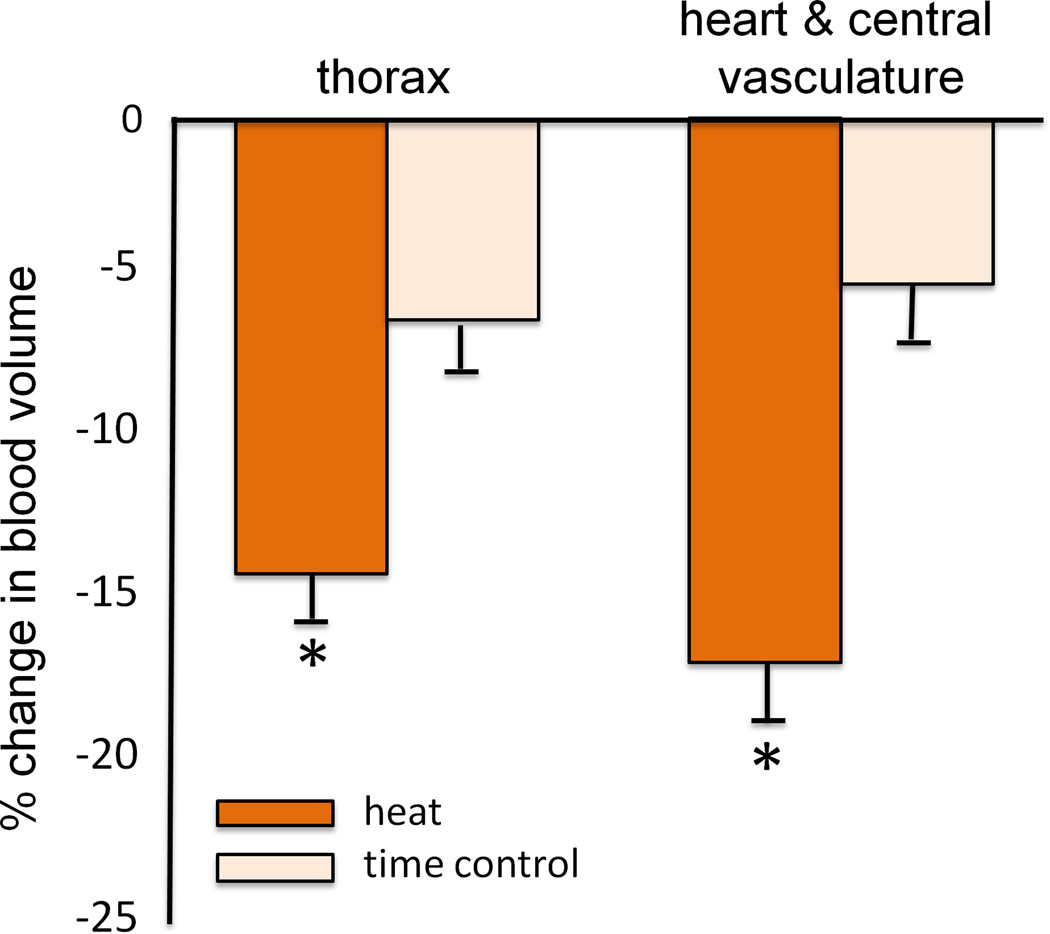
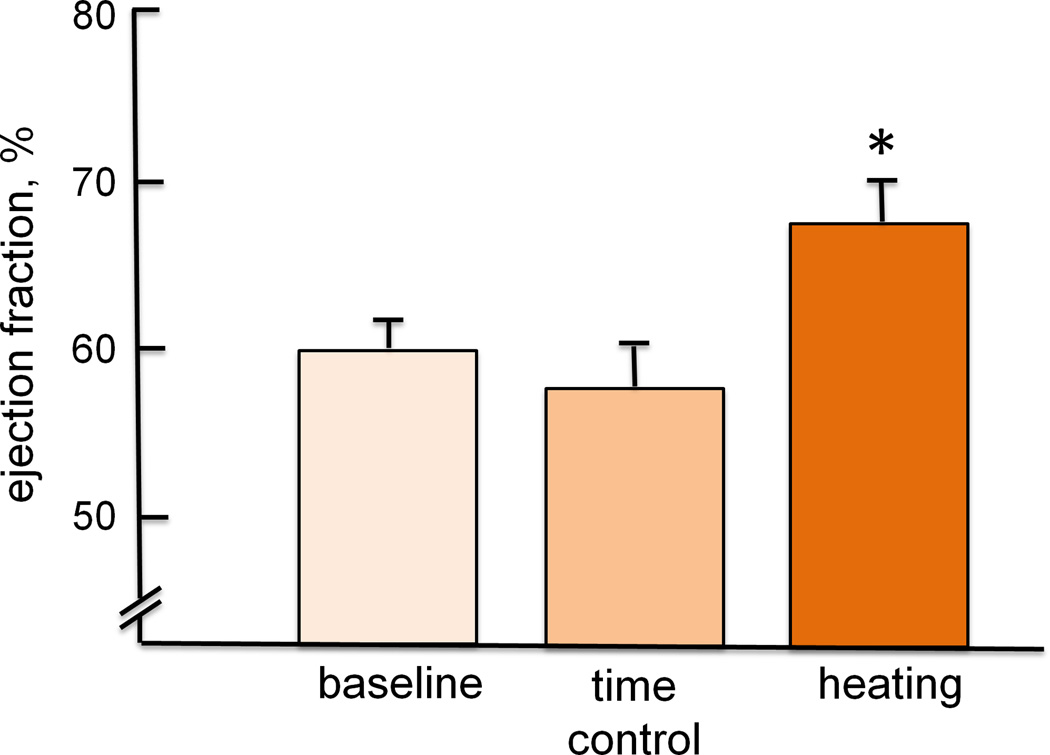
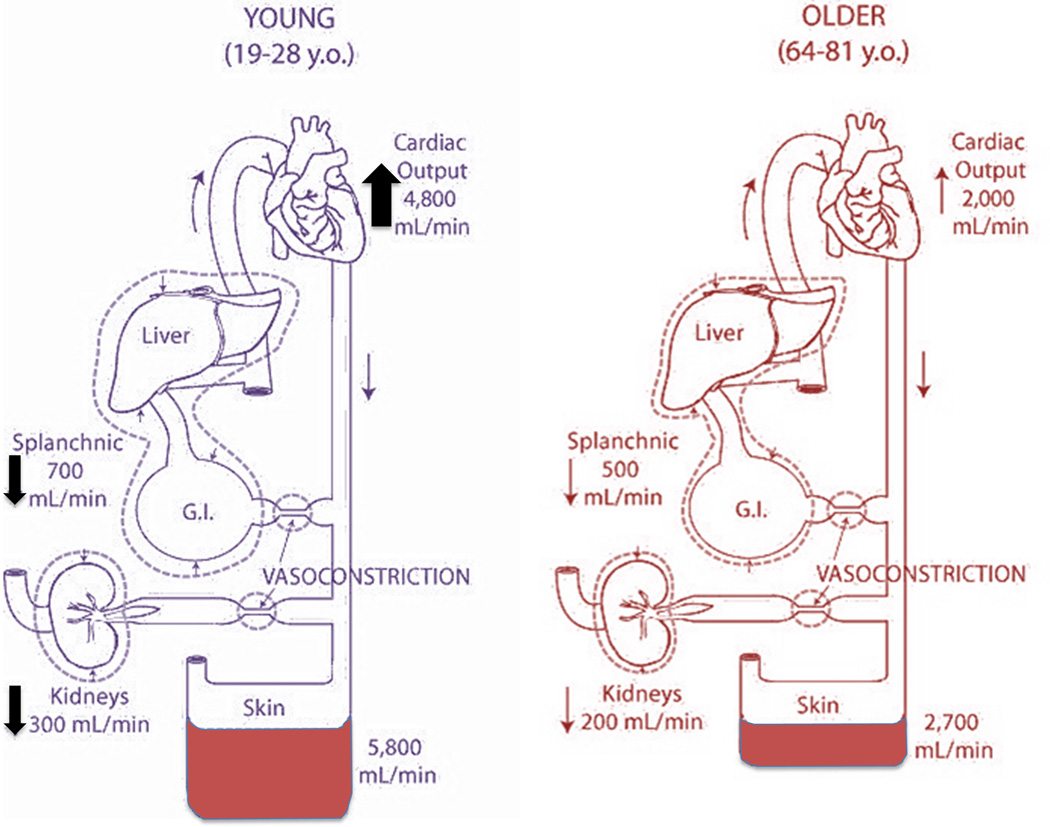
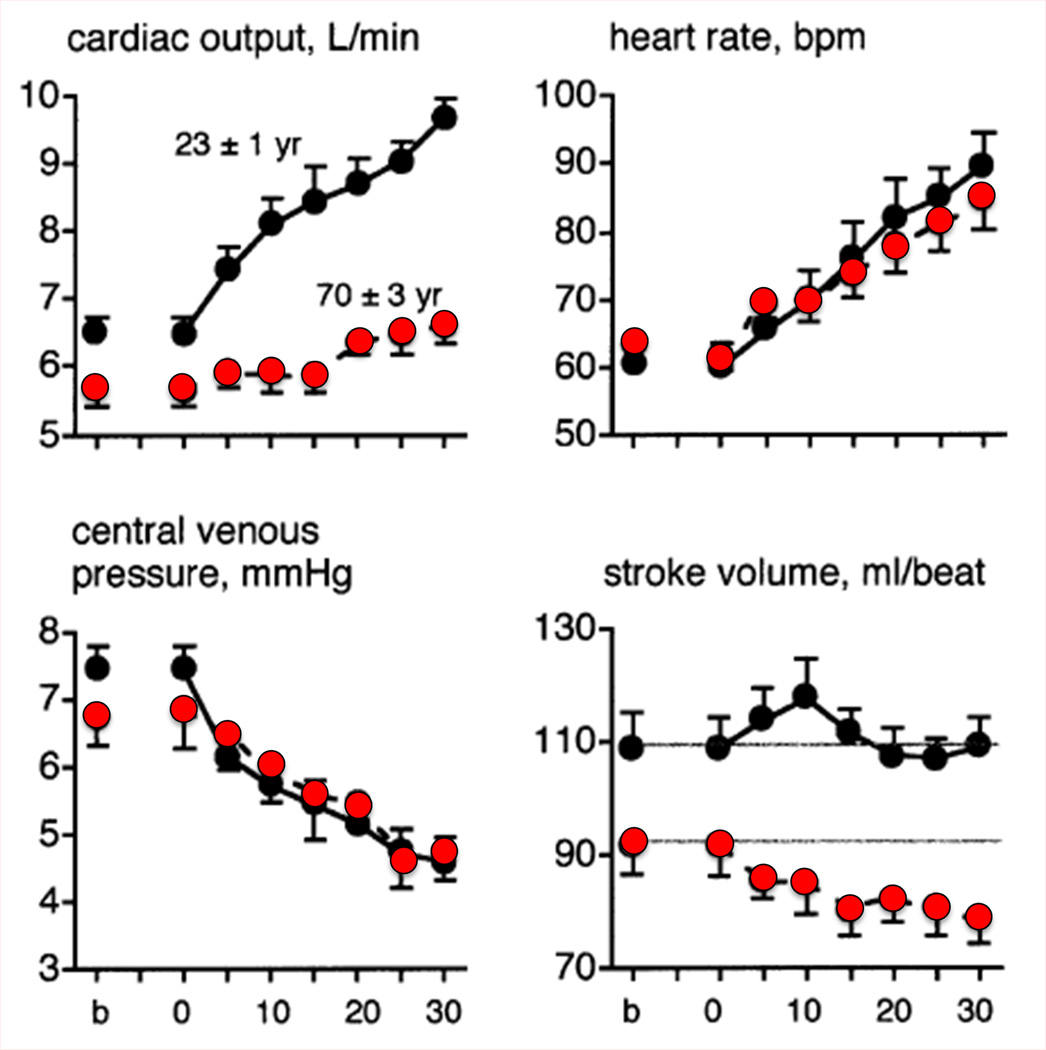
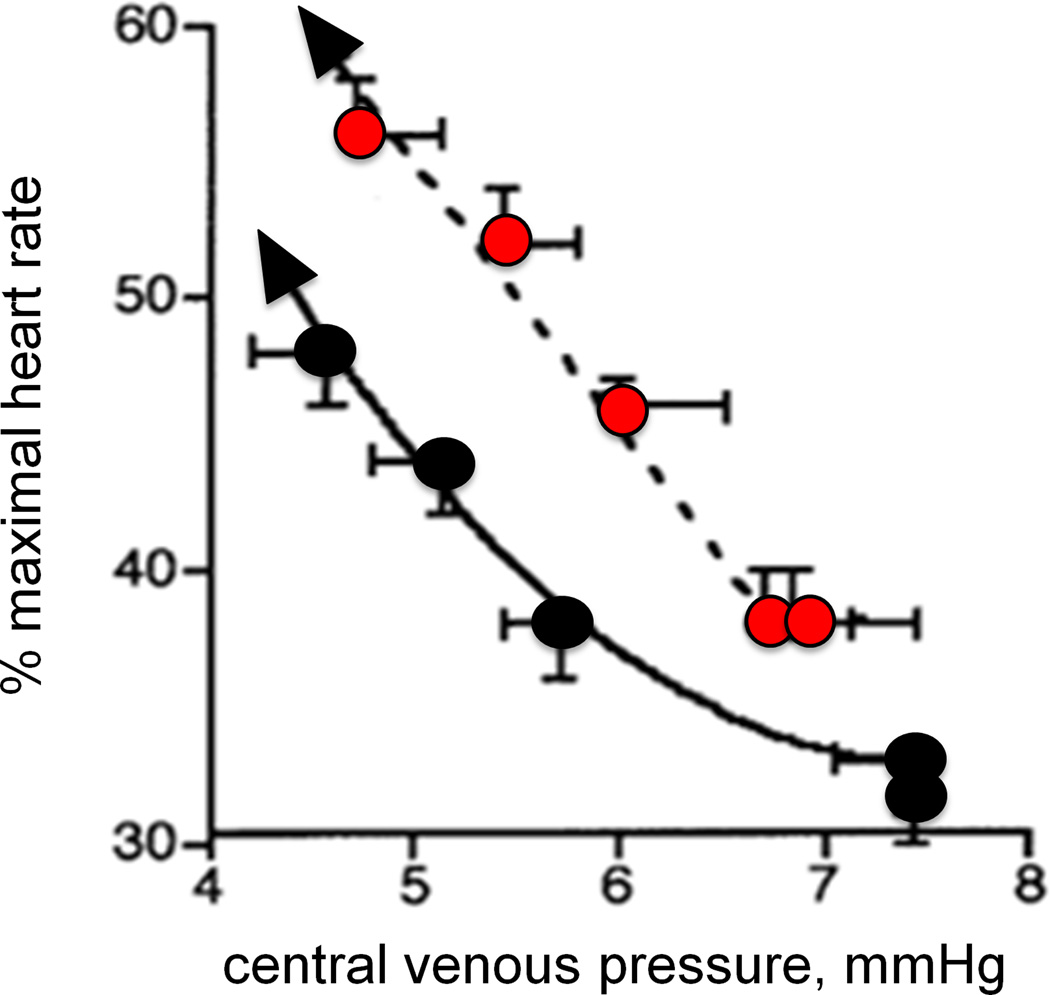
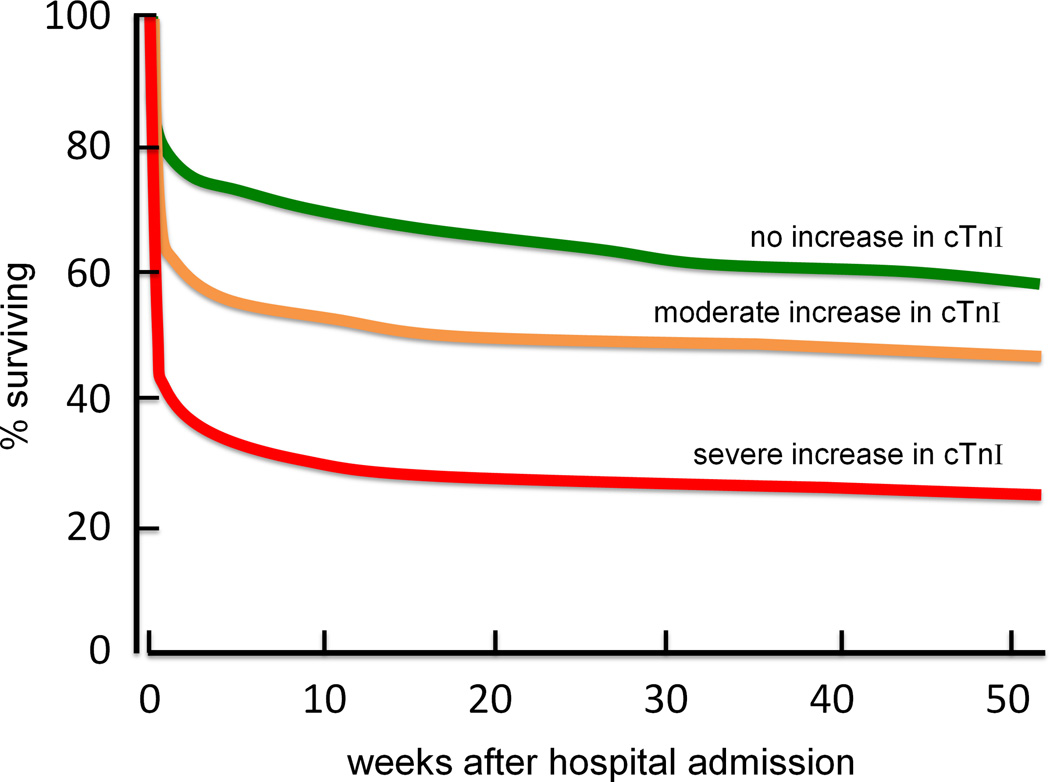
This brief review is based on a President's Lecture presented at the Annual Meeting of the American College of Sports Medicine in 2013. The purpose of this review was to assess the effects of climate change and consequent increases in environmental heat stress on the aging cardiovascular system. The earth's average global temperature is slowly but consistently increasing, and along with mean temperature changes come increases in heat wave frequency and severity. Extreme passive thermal stress resulting from prolonged elevations in ambient temperature and prolonged physical activity in hot environments creates a high demand on the left ventricle to pump blood to the skin to dissipate heat. Even healthy aging is accompanied by altered cardiovascular function, which limits the extent to which older individuals can maintain stroke volume, increase cardiac output, and increase skin blood flow when exposed to environmental extremes. In the elderly, the increased cardiovascular demand during heat waves is often fatal because of increased strain on an already compromised left ventricle. Not surprisingly, excess deaths during heat waves 1) occur predominantly in older individuals and 2) are overwhelmingly cardiovascular in origin. Increasing frequency and severity of heat waves coupled with a rapidly growing at-risk population dramatically increase the extent of future untoward health outcomes.


Conflict of interest statement

Conflict of interest

The authors have no conflicts of interest to report. No funding was received for this work. The contents of this review do not constitute endorsement by ACSM.

Figures

Figure 1
Figure 1
Daily deaths (left axis) and minimum and maximum air temperatures (right axis) during the 2003 French heat wave. The abnormally hot daily temperatures in early August 2003 were followed by a consequent dramatic increase in daily mortality, mostly among the elderly. Redrawn from Dousset et al. International Journal of Climatology 2011, 31:313–323; Royal Meteorological Society (14).
Figure 2
Figure 2
Mortality (green shaded area and red line) and maximum daily temperatures (dashed line) during the summer 1995 Chicago heat wave. Dates are shown along the x-axis. Mortality data in green represent the total death toll, while the superimposed red line depicts deaths from cardiovascular causes alone or from death certificates that mention combined cardiovascular and heat causes. Redrawn from Kaiser et al., American Journal of Public Health 2007, 97 Suppl 1:S158-62; APHA Press (35).
Figure 3
Figure 3
(A) The change in central blood volume, measured by technetium-99 scanning, with passive heat stress compared to a time control. Blood volume in the overall thorax and centered around the heart and central vasculature are shown. Heat stress significantly lowered blood volume compared to time control. (B) Ejection fraction at baseline, with passive heat stress and during a time control trial. Passive heat stress significantly increased ejection fraction compared to baseline and time control. Collectively, these data reflect the added strain on the left ventricle during passive heat stress, as contractility increased in light of a falling central venous pressure, to pump blood to the skin. Redrawn from Crandall et al., The Journal of Physiology 2008, 586(1): 293–301; The Physiological Society (11).
Figure 3
Figure 3
(A) The change in central blood volume, measured by technetium-99 scanning, with passive heat stress compared to a time control. Blood volume in the overall thorax and centered around the heart and central vasculature are shown. Heat stress significantly lowered blood volume compared to time control. (B) Ejection fraction at baseline, with passive heat stress and during a time control trial. Passive heat stress significantly increased ejection fraction compared to baseline and time control. Collectively, these data reflect the added strain on the left ventricle during passive heat stress, as contractility increased in light of a falling central venous pressure, to pump blood to the skin. Redrawn from Crandall et al., The Journal of Physiology 2008, 586(1): 293–301; The Physiological Society (11).
Figure 4
Figure 4
Changes in cardiac output, renal, splanchnic and cutaneous blood flow with passive heating to thermal tolerance (water-perfused suit) in young and older men. Young subjects increased cutaneous blood flow to a larger extent than did older subjects. The larger increase in cutaneous blood flow in the young men was accomplished by both raising cardiac output significantly more and by reducing renal and splanchnic blood flow to a higher degree compared with the older subjects. Redrawn from data published by Minson et al., Journal of Applied Physiology 1998, 84(4):1323-32; American Physiological Society (47).
Figure 5
Figure 5
Cardiac responses to prolonged passive heating as a function of (A) time and (B) central venous pressure in young (19–28 yrs; black circles) and older (64–81 yrs; red circles) men. Only the initial 30 min of heating are shown in panel A. Older subjects had a significantly attenuated rise in cardiac output and a decrease in stroke volume compared with young subjects, despite a similar fall in central venous pressure. Stroke volume was well maintained in the young men. As shown in panel B, the fall in central venous pressure (CVP) (right to left along the x-axis) due to venous blood pooling caused a similar increase in absolute heart rate (see panel A) but a larger rise in HR as a percent of maximal heart rate. Heart rate reserve is consequently lower in the older men at any given level of heat stress (and CVP). Redrawn from data published by Minson et al., Journal of Applied Physiology 1998, 84(4):1323-32; American Physiological Society (47).
Figure 5
Figure 5
Cardiac responses to prolonged passive heating as a function of (A) time and (B) central venous pressure in young (19–28 yrs; black circles) and older (64–81 yrs; red circles) men. Only the initial 30 min of heating are shown in panel A. Older subjects had a significantly attenuated rise in cardiac output and a decrease in stroke volume compared with young subjects, despite a similar fall in central venous pressure. Stroke volume was well maintained in the young men. As shown in panel B, the fall in central venous pressure (CVP) (right to left along the x-axis) due to venous blood pooling caused a similar increase in absolute heart rate (see panel A) but a larger rise in HR as a percent of maximal heart rate. Heart rate reserve is consequently lower in the older men at any given level of heat stress (and CVP). Redrawn from data published by Minson et al., Journal of Applied Physiology 1998, 84(4):1323-32; American Physiological Society (47).
Figure 6
Figure 6
Patient survival curves following emergency admission to hospitals during the weeks after the 2003 heat wave in France. Separate curves are drawn for patients (mean age = 84 yrs) who had no elevation in cardiac troponin I (cTnI) (n = 252; green line), a moderate increase (up to 1.5 ng.mL−1, n = 165; orange line), and a severe increase in cTnI (>1.5 ng.mL−1, n = 97; red line). These data support the association between heat stress and cardiac strain in the elderly during environmental heat waves. Redrawn from data originally published by Hausfater et al., Critical Care 2010, 14:R99; BioMed Central publishing (22).

References

    1. [cited 8/26/2013];A profile of older Americans: 2012. 2012 Available from: http://www.aoa.gov/AoARoot/Aging_Statistics/Profile/2012/2.aspx.
    1. Anderson RK, Kenney WL. Effect of age on heat-activated sweat gland density and flow during exercise in dry heat. Journal of applied physiology. 1987;63(3):1089–1094. - PubMed
    1. Baccini M, Biggeri A, Accetta G, Kosatsky T, Katsouyanni K, Analitis A, et al. Heat effects on mortality in 15 European cities. Epidemiology. 2008;19(5):711–719. - PubMed
    1. Basu R, Malig B. High ambient temperature and mortality in California: exploring the roles of age, disease, and mortality displacement. Environmental research. 2011;111(8):1286–1292. - PubMed
    1. Beckman JS. Oxidative damage and tyrosine nitration from peroxynitrite. Chemical research in toxicology. 1996;9(5):836–844. - PubMed