. 2014 Mar 5;9(3):e90917.
doi: 10.1371/journal.pone.0090917. eCollection 2014.

p-Hydroxyphenylpyruvate, an intermediate of the Phe/Tyr catabolism, improves mitochondrial oxidative metabolism under stressing conditions and prolongs survival in rats subjected to profound hemorrhagic shock

Affiliations

p-Hydroxyphenylpyruvate, an intermediate of the Phe/Tyr catabolism, improves mitochondrial oxidative metabolism under stressing conditions and prolongs survival in rats subjected to profound hemorrhagic shock

Antonella Cotoia et al. PLoS One. .

Abstract

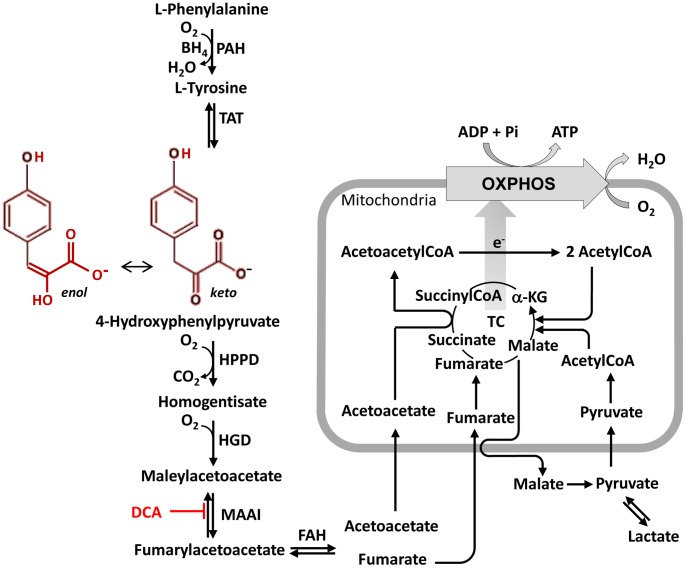
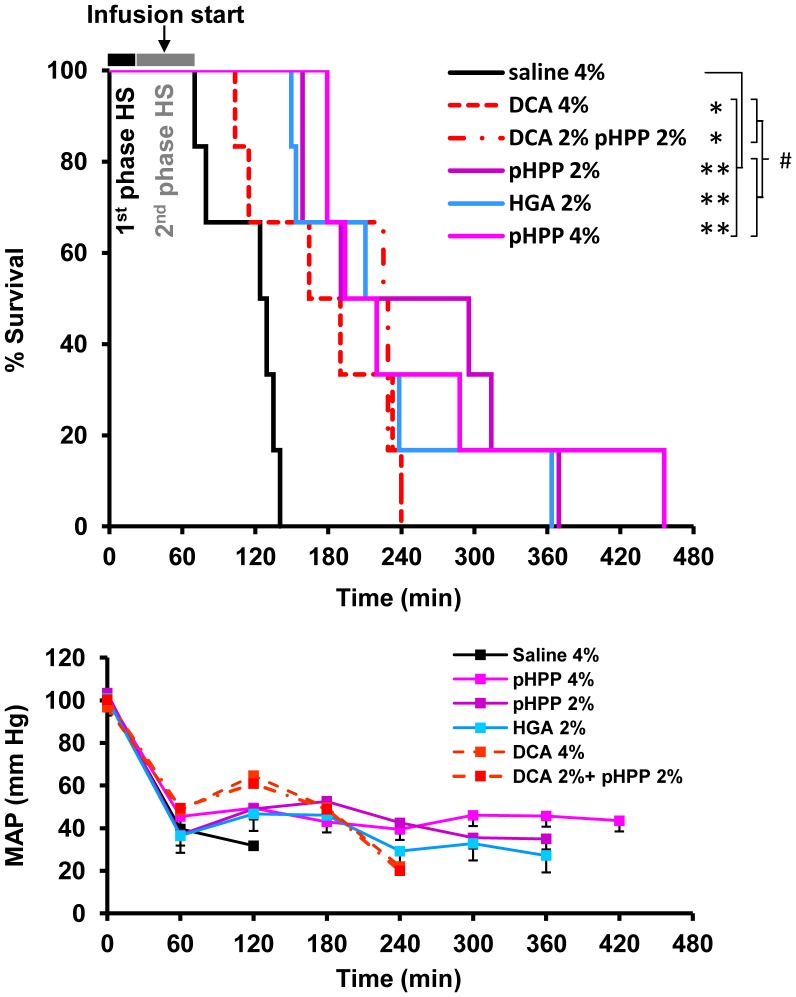
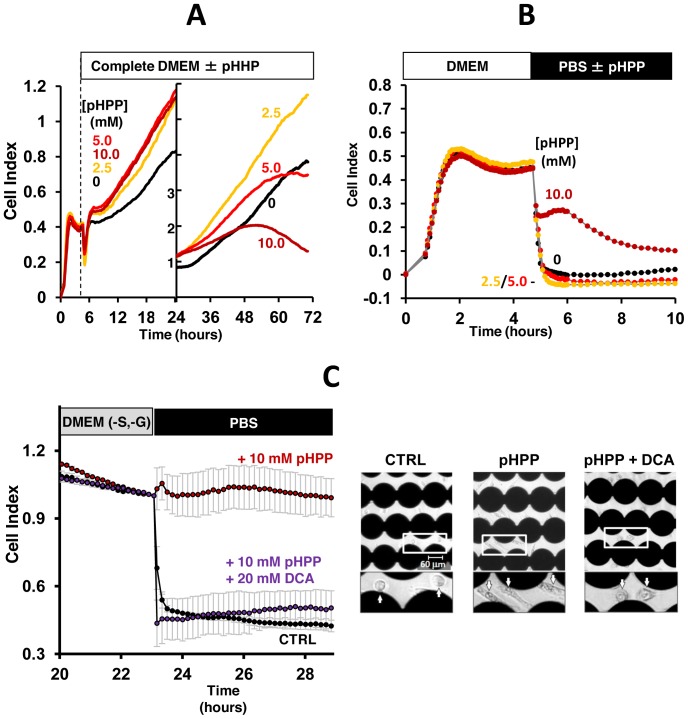
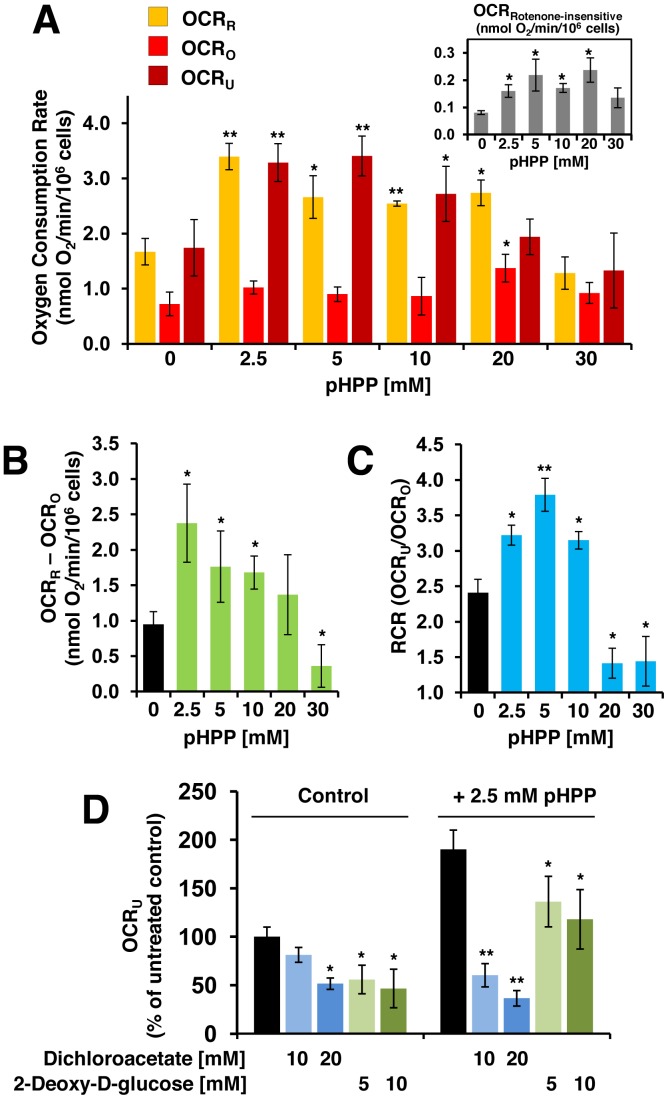
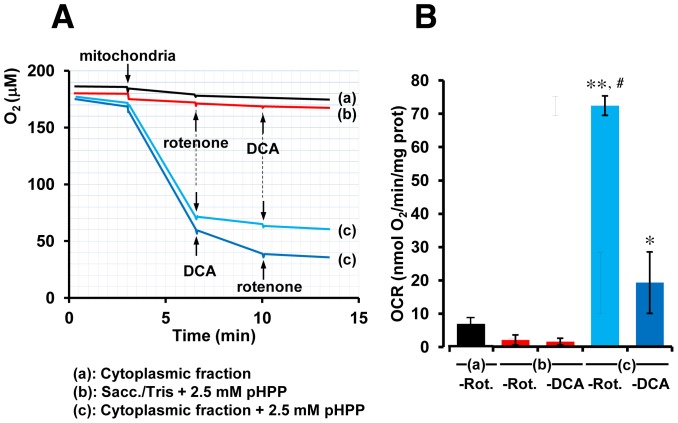
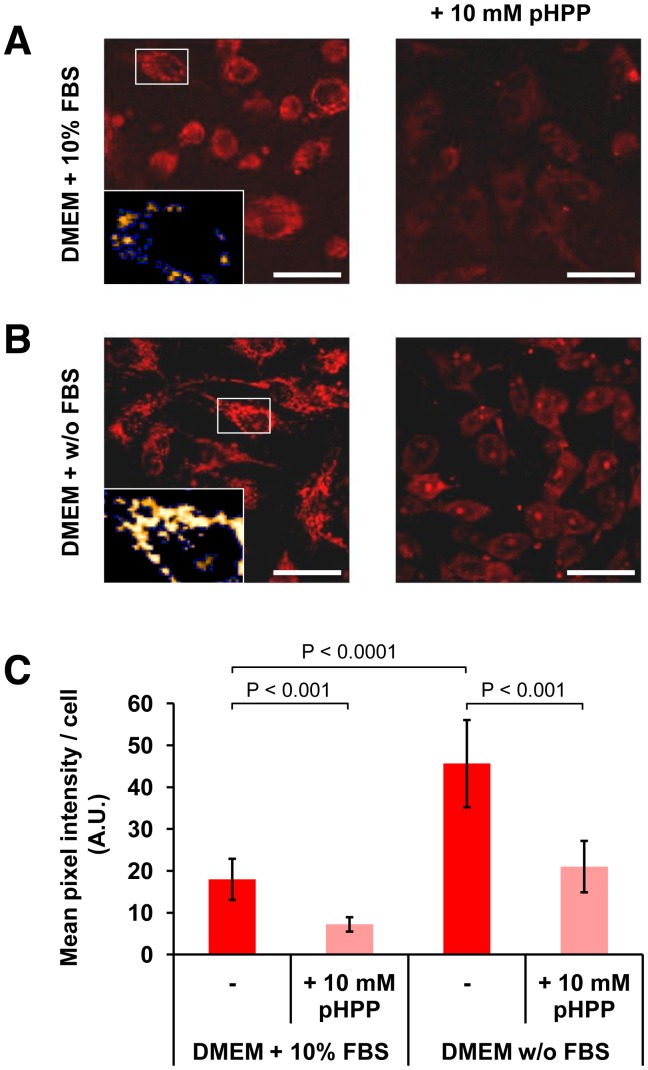
The aim of this study was to test the effect of a small volume administration of p-hydroxyphenylpyruvate (pHPP) in a rat model of profound hemorrhagic shock and to assess a possible metabolic mechanism of action of the compound. The results obtained show that hemorrhaged rats treated with 2-4% of the estimated blood volume of pHPP survived significantly longer (p<0.001) than rats treated with vehicle. In vitro analysis on cultured EA.hy 926 cells demonstrated that pHPP improved cell growth rate and promoted cell survival under stressing conditions. Moreover, pHPP stimulated mitochondria-related respiration under ATP-synthesizing conditions and exhibited antioxidant activity toward mitochondria-generated reactive oxygen species. The compound effects reported in the in vitro and in vivo analyses were obtained in the same millimolar concentration range. These data disclose pHPP as an efficient energetic substrates-supplier to the mitochondrial respiratory chain as well as an antioxidant supporting the view that the compound warrants further evaluation as a therapeutic agent.


Conflict of interest statement

Competing Interests: The authors have declared that no competing interests exist.

Figures

Figure 1
Figure 1. Catabolic pathway of phe/tyr.
The scheme illustrates the individual enzymatic steps and intermediates of the catabolism of phe/tyr to acetoacetate and fumarate in the cytoplasmic compartment and their further metabolization within mitochondria. PAH, phenylalanine hydroxylase; BH4, tetrahydrobiopterin; TAT, tyrosine aminotransferase; HPPD, 4-hydroxyphenylpyruvate dioxygenase; HGD, homogentisate dioxygenase; MAAI, maleylacetoacetate isomerase; FAH, fumarylacetoacetate hydrolase; DCA, dichloroacetate; TC, tricaboxylic acid cycle; OXPHOS, oxidative phosphorylation.
Figure 2
Figure 2. Survival and hemodynamic analysis of rat subjected to severe volume-controlled HS.
Rats were subjected to severe volume-controlled HS as described in Materials and Methods. Twenty min before the end of the hemorrhage, rats were infused with either of the following small-volume solutions: saline 2.8 ml/kg (4% of EBV; saline 4%); 0.25 mmol/kg of pHPP in 2.8 ml/kg of saline (4% EBV; pHPP 4%); 0.25 mmol/kg of pHPP in 1.4 ml/kg of saline (2% EBV; pHPP 2%); 0.25 mmol/kg of HGA in 2% EBV of saline (HGA 2%); 1 g/kg of DCA in 4% EBV of saline (DCA 4%); 1 g/kg of DCA in 2% EBV of saline +0.25 mmol/kg of pHPP in 2% EBV of saline (DCA 2%+pHPP 2%). Panel A shows Kaplan-Meier survival curves. * and #, P<0.05; **, P<0.001. Panel B shows mean arterial pressure of rats subjected to HS.
Figure 3
Figure 3. Effect of pHPP on cell growth and cell viability under stressing conditions.
EA.hy 926 cells (104 in 100 µl of complete DMEM +10% FBS) were left to adhere to the bottom of the impedentiometric microplate wells in a controlled environment. Impedance was recorded continuously every 5 min and expressed as cell index (CI). (A) Once the CI reached a steady value, the medium was substituted with DMEM containing dissolved pHPP at the indicated concentrations and the impedance recorded for three days. The time scale has been split to distinguish early from late phases and the CI scale enlarged in the left part of the diagram. The values shown are means of 2 independent experiments. (B) Cells were incubated in complete DMEM for 5 h and then the medium substituted with PBS without or with the indicated concentrations of pHPP and the CI recorded for the following 5 h. The values shown are means of 2 independent experiments. (C) Cells were incubated with serum- and glucose-free DMEM (DMEM -S, -G) without or with 10 mM pHPP±20 mM DCA and CI recorded for the following 23 h. Subsequently, the medium was changed to PBS supplemented without or with the same compounds as before. The traces were normalized to the CI values reached before the medium change; each time point is the average ± SEM of 3 independent experiments. The right panel depicts representative phase contrast micrographs of the cells at the end of the experiment; the dark connected circles are the micro-electrodes at the bottom of the impedentiometric wells.
Figure 4
Figure 4. Respirometric analysis of EA.hy 926 cells.
Intact EA.hy 926 cells were assayed by high-resolution respirometry in the buffer described in Materials and Methods supplemented with the indicated concentrations of pHPP. Panel A depicts OCR measured under resting phosphorylating conditions (OCRR), in the presence of FoF1-ATP synthase inhibitor oligomycin (OCRO), or in the presence of the protonophoric uncoupler FCCP (OCRU). The bar-values were corrected for the residual OCR measured in the presence of the respiratory chain blocker rotenone (shown in the inset) and are means ± SEM of 4–6 independent experiments under each condition. Panel B shows OCR linked to ATP synthesis obtained from the values shown in (A) subtracting OCRO from the OCRR. Panel C shows the respiratory control ratios (RCR) obtained from the values shown in (A) dividing OCRU by the OCRO. *, P<0.05; **, P<0.01 (vs untreated). (D) OCRU was measured as described in (A); the inhibitors of the tyrosine catabolism and of glycolysis (DCA and 2-DG, respectively) were tested at the indicated concentrations on the respiratory activity assessed in the absence or in the presence of 2.5 mM pHPP. The bar values are percentages of the OCRU measured in control untreated cells and are the means ± SEM of 4–5 independent experiments under each condition. *, P<0.05, **, P<0.01 (vs inhibitor-untreated).
Figure 5
Figure 5. Effect of subcellular fractions on pHPP-dependent respiratory activity.
(A) Representative respirometric traces. Isolated beef heart mitochondria were added, where indicated, at the concentration of 0.5 mg prot/ml in either of: (trace a) the cytoplasmic fraction isolated from bovine heart homogenate; (trace b) 0.25 M sucrose, 0.1 mM EDTA, 10 mM Tris-HCl pH 7.8 containing 2.5 mM of dissolved pHPP; (traces c) the cytoplasmic subcellular fraction containing 2.5 mM of pHPP. Where indicated, 2 µM rotenone or 10 mM DCA were added. (B) The histogram shows the mitochondrial OCR (means ± SEM) of three independent experiments under each condition, measured in the absence (a) or in the presence (b and c) of pHPP; the values shown were corrected for the rotenone (-rot.)- or the DCA (-DCA)-insensitive OCR. * and ** indicate P<0.05 and P<0.001 vs the other conditions; #, P<0.01 ((c)-Rot. vs (c)-DCA).
Figure 6
Figure 6. Confocal microscopy analysis of the effect of pHPP on production of mitochondrial superoxide anion in cultured cells.
EA.hy 926 cells were grown on coverslips in complete DMEM +10% FBS (A) or without FBS (B) (for 4 hours) either in the absence and in the presence of 10 mM pHPP followed by addition of the mt-O2 .− fluorescent probe MitoSox (0.5 µM, 15 min incubation). The pictures are optical fields under each condition as imaged by laser scanning confocal microscopy and are representative of two independent experiments yielding similar outcomes. White bar: 50 µm. The insets show selected enlargements rendered to highlight the intracellular compartmentalization of the fluorescent signal. (C) Histogram showing the quantitative analysis of the intracellular fluorescent signal along with the statistical significance of the differences; bars indicate mean values ± SD from 5 randomly selected optical fields/experiment taken under each condition (each optical field contained ≈20 cells). See under Materials and Methods for further details.

Similar articles

Cited by

References

    1. Kauvar DS, Lefering R, Wade CE (2006) Impact of hemorrhage on trauma outcome: an overview of epidemiology, clinical presentations, and therapeutic considerations. J Trauma 60(6 Suppl): S3–11. - PubMed
    1. Peitzman AB, Billiar TR, Harbrecht BG, Kelly E, Udekwu AO, et al. (1995) Hemorrhagic shock. Curr Probl Surg 32: 925–1002. - PubMed
    1. Cairns CB (2001) Rude unhinging of the machinery of life: metabolic approaches to hemorrhagic shock. Opin Crit Care 7: 437–443. - PubMed
    1. McSwain NE, Champion HR, Fabian TC, Hoyt DB, Wade CE, et al... (2010) State of the art of fluid resuscitation 2010: prehospital and immediate transition to the hospital. J Trauma 70(5 Suppl): S2–10. - PubMed
    1. Riddez L, Drobin D, Sjostrand F, Svensen C, Hahn RG (2002) Lower dose of hypertonic saline dextran reduces the risk of lethal rebleeding in uncontrolled hemorrhage. Shock 17: 377–382. - PubMed

Publication types

MeSH terms

LinkOut - more resources