. 2014 Mar 5;9(3):e90044.
doi: 10.1371/journal.pone.0090044. eCollection 2014.

Objective assessment of spectral ripple discrimination in cochlear implant listeners using cortical evoked responses to an oddball paradigm

Affiliations

Objective assessment of spectral ripple discrimination in cochlear implant listeners using cortical evoked responses to an oddball paradigm

Alejandro Lopez Valdes et al. PLoS One. .

Abstract

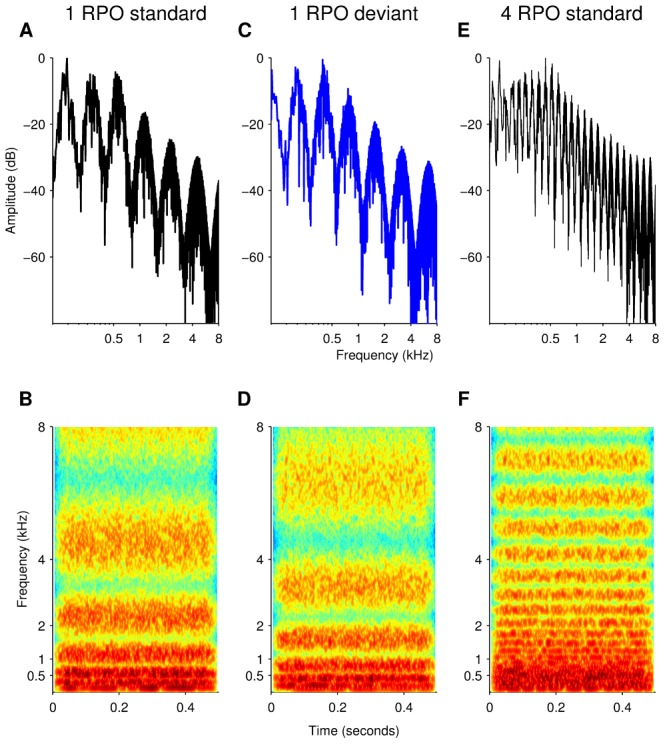
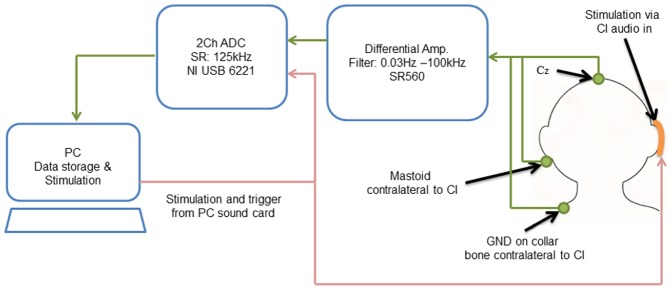
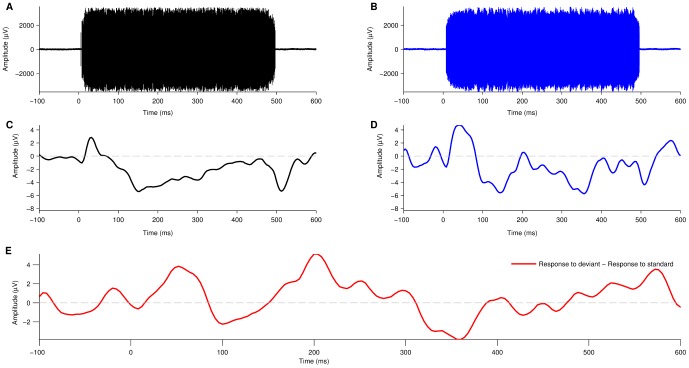
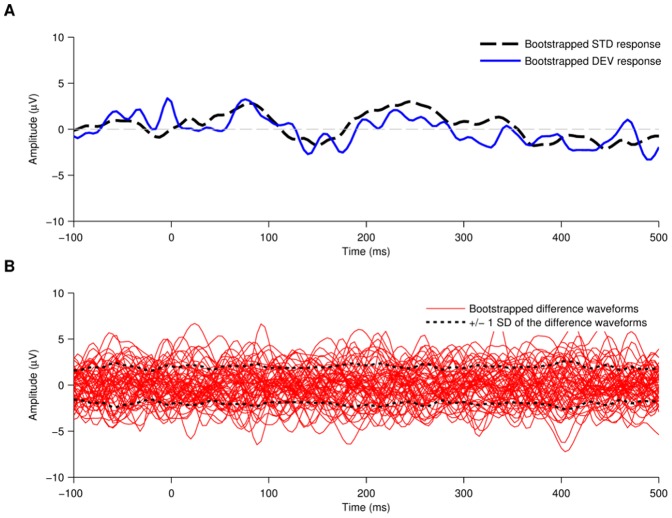
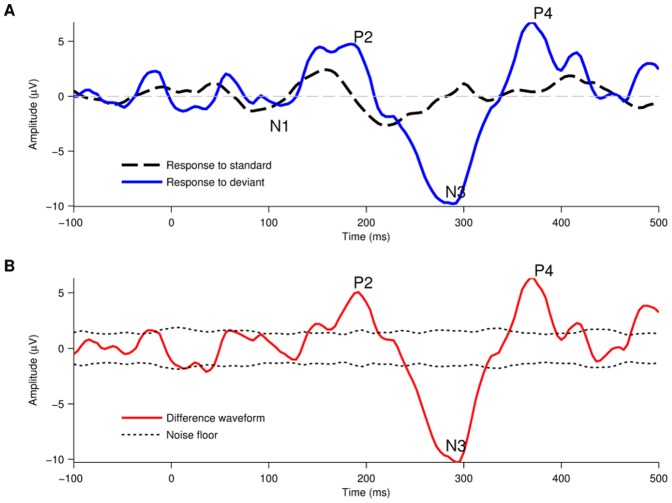
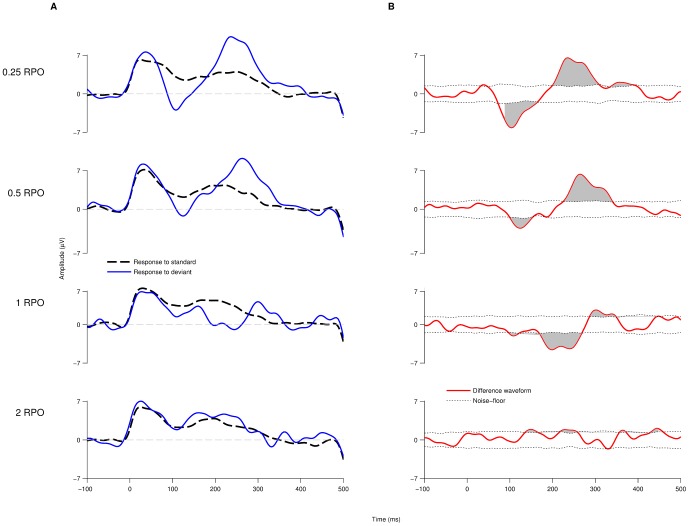
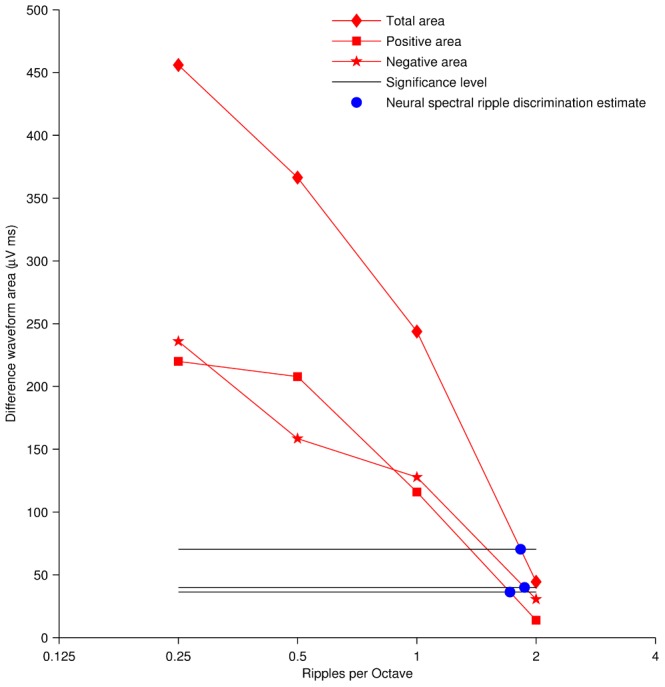
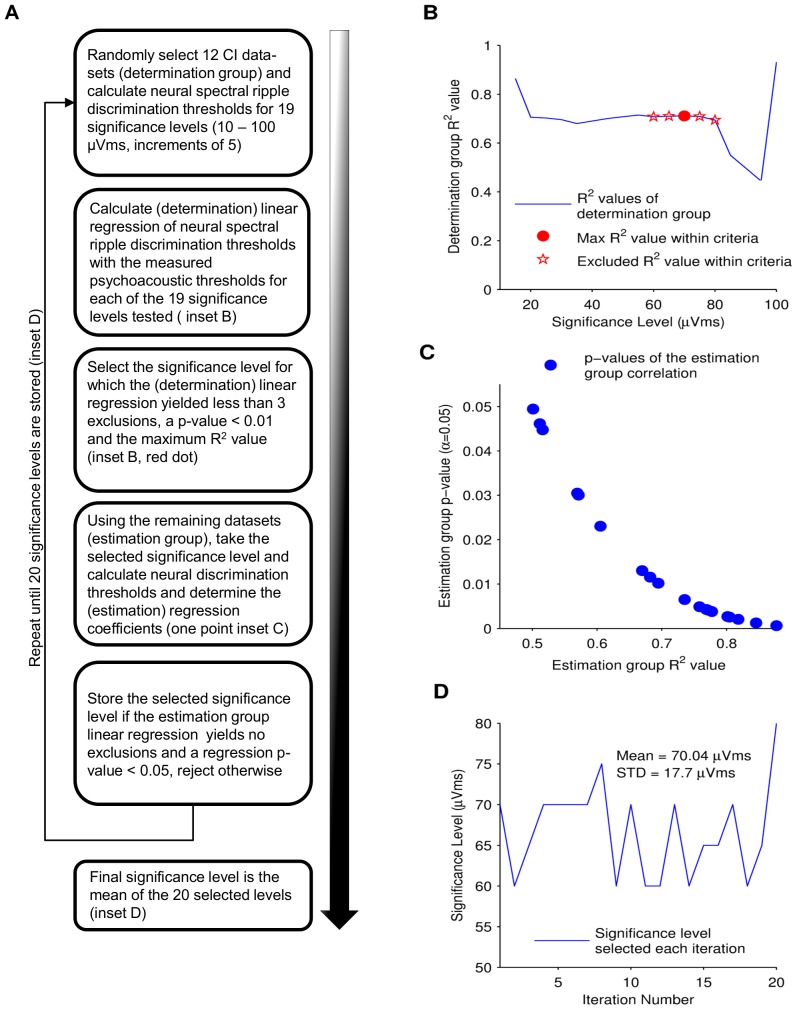
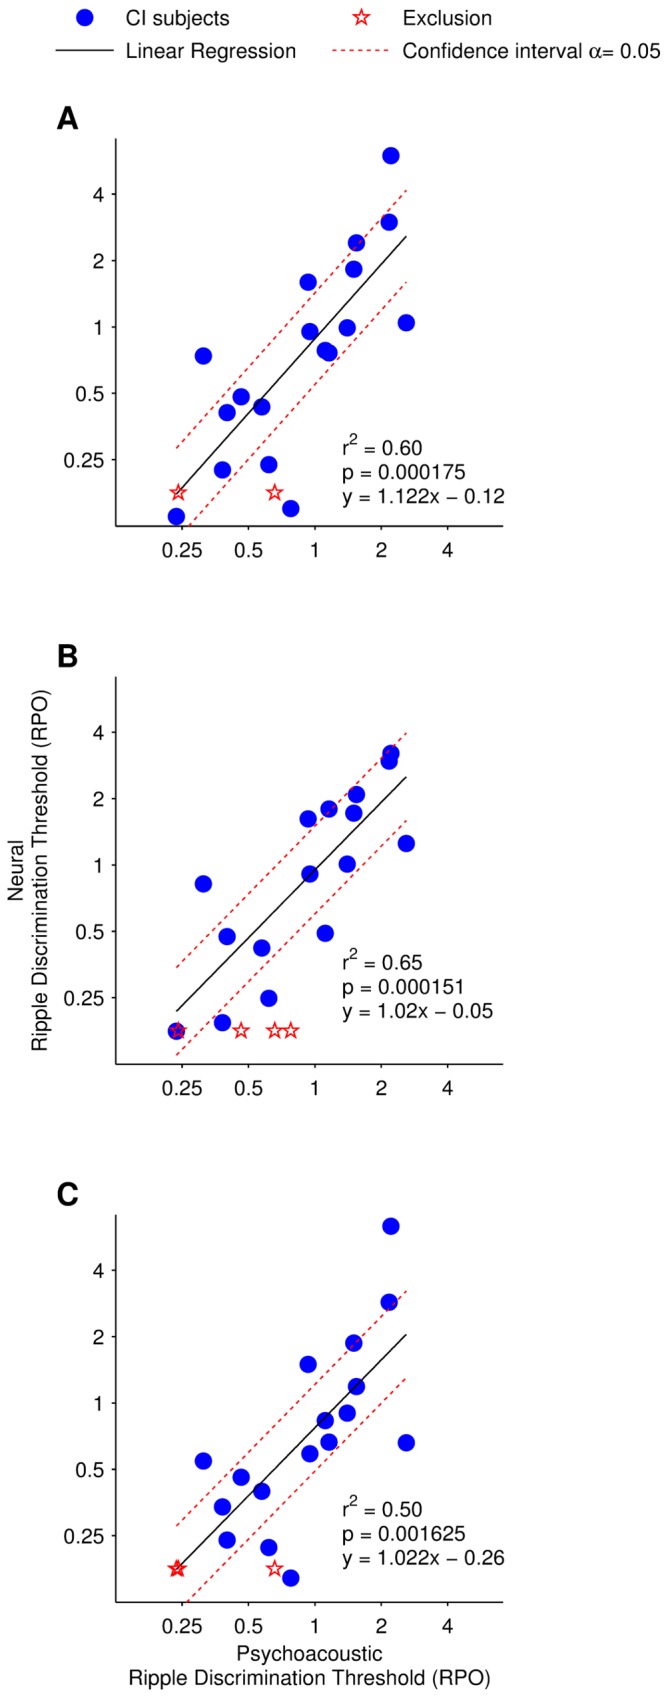
Cochlear implants (CIs) can partially restore functional hearing in deaf individuals. However, multiple factors affect CI listener's speech perception, resulting in large performance differences. Non-speech based tests, such as spectral ripple discrimination, measure acoustic processing capabilities that are highly correlated with speech perception. Currently spectral ripple discrimination is measured using standard psychoacoustic methods, which require attentive listening and active response that can be difficult or even impossible in special patient populations. Here, a completely objective cortical evoked potential based method is developed and validated to assess spectral ripple discrimination in CI listeners. In 19 CI listeners, using an oddball paradigm, cortical evoked potential responses to standard and inverted spectrally rippled stimuli were measured. In the same subjects, psychoacoustic spectral ripple discrimination thresholds were also measured. A neural discrimination threshold was determined by systematically increasing the number of ripples per octave and determining the point at which there was no longer a significant difference between the evoked potential response to the standard and inverted stimuli. A correlation was found between the neural and the psychoacoustic discrimination thresholds (R2=0.60, p<0.01). This method can objectively assess CI spectral resolution performance, providing a potential tool for the evaluation and follow-up of CI listeners who have difficulty performing psychoacoustic tests, such as pediatric or new users.


Conflict of interest statement

Competing Interests: The authors have declared that no competing interests exist.

Figures

Figure 1
Figure 1. Stimuli characterization.
(A) Frequency spectrum of a 500 ms standard stimulus with spectral peak density of one ripple per octave (RPO). Stimuli were composed of the sum of pure tones in a range of 0.25–5 kHz (psychoacoustic) or 0.1–8 kHz (electrophysiology). Spectral amplitudes were defined by a full-wave rectified sinusoidal envelope. One spectral peak can be clearly distinguished at the 0.5–1 kHz octave. Peak to valley amplitude of 30 dB as well as the high frequency attenuation of the speech-shaped filter can also be seen. (B) Spectrogram of the standard stimulus described, showing the frequency content of the stimulus along the 500 ms duration. Spectral peak density of one RPO can clearly be resolved in the 4–8 kHz octave. (C) Frequency spectrum of the corresponding phase-inverted, or deviant, stimulus employed along with the standard stimulus at one RPO in an oddball paradigm. The spectral envelope is shifted by π/2 with respect to the standard stimulus, as observed in the 0.5–1 kHz octave. (D) Spectrogram of the deviant stimulus, showing the inversed frequency content along the 500 ms duration with respect to the standard stimulus. (E) Frequency spectrum of a standard stimulus with spectral peak density of four RPO showing the increased spectral density with respect to the one RPO stimuli. (F) Spectrogram of the standard stimulus at four RPO. Spectral peak density of four RPO can clearly be resolved in the 4–8 kHz octave.
Figure 2
Figure 2. Single-channel acquisition set-up.
Single-channel EEG acquisition system, featuring wideband and high-sampling rate recordings. EEG is recorded from electrode position Cz, referenced to the mastoid contralateral to the tested ear and grounded on the collar bone. The EEG signal is amplified with a biological differential pre-amplifier (SR560, Stanford Research System, Sunnyvale, CA) with filter settings at 0.03 Hz and 100 kHz. The signal is then digitized with an ADC (NI-USB 6221, National Instruments, Austin, TX) sampled at 125 kHz and recorded with a custom made software made in MATLAB (The MathWorks, Natick, MA). Stimulus and trigger presentation is done through the sound card of the computer. The trigger is fed to the ADC for event synchronization and the stimulus is presented via a personal audio cable to the auxiliary port of the subject's speech processor.
Figure 3
Figure 3. Artifact attenuation and evoked potential extraction.
(A)–(B) Single EEG acquisition epoch of a 500 ms stimulus presented to a CI user. Data acquisition at a high-sampling rate (125 kHz) allows for the CI artifact to be clearly resolved from the recorded data as a high frequency and large amplitude component present during the 500 ms of stimulus duration (standard in black, deviant in blue). (C)–(D) Applying a 2nd order Butterworth band-pass filter (2–20 Hz) to the averaged epochs, recorded from an oddball paradigm, it is possible to attenuate the CI artifact and extract the evoked potential (EP) elicited to the each stimulus type (standard in black, deviant in blue). The N100, characteristic of auditory EPs can be identified in both standard (C) and deviant (D) stimuli types as a negative peak at around 100–150 ms. In some cases, after filtering, a low-frequency artifact is present at stimulus onset and offset with similar shape and amplitude in both standard and deviant responses. (E) A difference waveform is calculated by subtracting the neural response elicited to the standard stimuli from the neural response elicited to the deviant stimuli. This method allows further attenuation of residual low-frequency artifacts.
Figure 4
Figure 4. Noise floor calculation of the neural response.
(A) The noise floor was calculated with a statistical bootstrap method. A random 10% sub-sample of epochs from the standard stimulus type was averaged to create a bootstrapped deviant response whilst the remaining epochs were averaged together to create a bootstrapped standard response. (B) A difference waveform was calculated by subtracting the bootstrapped standard response from the bootstrapped deviant response. This process was repeated 54 times, each time with a different randomly selected 10% sample of standard epochs. The noise floor of the signal was defined as +/− one standard deviation of the 54 resulting difference waveforms.
Figure 5
Figure 5. Example of the difference waveform elicited using the oddball paradigm.
(A) Evoked potential responses elicited to 608 standard stimuli and 65 deviant stimuli at 0.25 RPO. When the standard and deviant stimuli are perceived as different sounds, the morphology of the neural response to the deviant stimuli (blue trace) is significantly different than the response to the standard stimuli (dashed, black trace). (B) The difference waveform represents the mismatch between the responses elicited to each stimulus type.
Figure 6
Figure 6. Sequential decrease of the difference waveform's area above the noise floor.
(A) Evoked potential traces of standard and deviant stimuli elicited at 0.25, 0.5, 1 and 2 RPO. As the spectral density increases, the neural responses to the standard and deviant stimuli become more similar. (B) The difference waveform at each spectral density shows a sequential decrease of the mismatch between the responses elicited to each stimulus type. The area above the noise floor of the signal (shaded grey) is taken as an indicator of said mismatch decrease.
Figure 7
Figure 7. Estimation of the spectral ripple discrimination threshold based on neural responses.
The neural spectral ripple discrimination threshold is estimated as the point where the mismatch between the neural responses dropped below a set significance level. Thresholds were estimated with three different area above the noise floor measurements: positive area, negative area and total area above the noise floor.
Figure 8
Figure 8. Bootstrapped determination of the significance level.
(A) Describes the progression of the bootstrapping method employed to determine the level at which neural spectral ripple discrimination thresholds were estimated and regressed with the measured psychoacoustic thresholds. (B) The square of the Pearson's correlation factor (R2) vs. the 19 significant levels tested on the determination group is plotted. The significance level that yields the maximum R2 value within the selection criteria, identified as the red point in the plot, is selected to continue with the bootstrap method, the rest are excluded (hollow stars). (C) The selected significance level is evaluated with estimation group. The regression's p-value plotted vs. the regression's R2 value resulting from the significance level evaluation on the estimation group for 20 bootstrap iterations. If the evaluation yields no exclusions and a p-value less than 0.05, the significance level is stored. (D) The bootstrap method is repeated to select 20 different significant levels. The mean of the selected values is employed as the final significance level.
Figure 9
Figure 9. Correlation of neural and psychoacoustic spectral ripple discrimination thresholds.
Linear regression of the psychoacoustic spectral ripple discrimination thresholds with the neural spectral ripple discrimination thresholds for each of the analyzed area above the noise floor measurements: (A) total area above the noise floor; (B) Positive area above the noise floor; and (C) negative area above the noise floor.

Similar articles

Cited by

References

    1. Zeng F-G (2004) Trends in cochlear implants. Trends in Amplification 8: 1–34. - PMC - PubMed
    1. Waltzman SB, Roland JT (2005) Cochlear implantation in children younger than 12 months. Pediatrics 116: e487–e493. - PubMed
    1. van Dijk JE, van Olphen AF, Langereis MC, Mens LH, Brokx JP, et al. (1999) Predictors of cochlear implant performance. Audiology 38: 109–116. - PubMed
    1. Blamey P, Arndt P, Bergeron F, Bredberg G, Brimacombe J, et al. (1996) Factors affecting auditory performance of postlinguistically deaf adults using cochlear implants. Audiology and Neurotology 1: 293–306. - PubMed
    1. Clark JH, Yeagle J, Arbaje AI, Lin FR, Niparko JK, et al. (2012) Cochlear implant rehabilitation in older adults: literature review and proposal of a conceptual framework. Journal of the American Geriatrics Society 60: 1936–1945. - PMC - PubMed

Publication types