. 2014 Jul 15;23(14):3865-74.
doi: 10.1093/hmg/ddu101. Epub 2014 Mar 5.

Neuronal Tsc1/2 complex controls autophagy through AMPK-dependent regulation of ULK1

Affiliations

Neuronal Tsc1/2 complex controls autophagy through AMPK-dependent regulation of ULK1

Alessia Di Nardo et al. Hum Mol Genet. .

Abstract

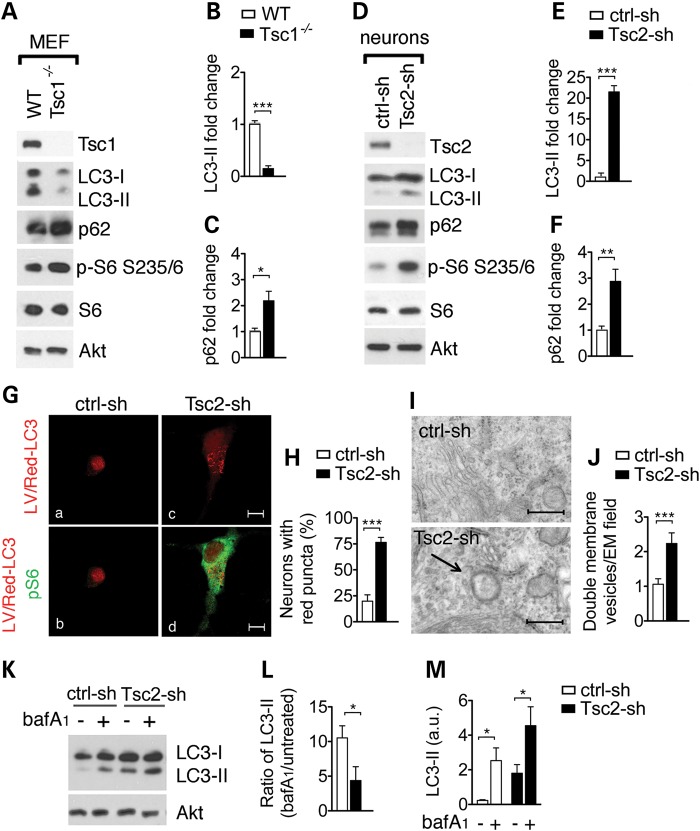
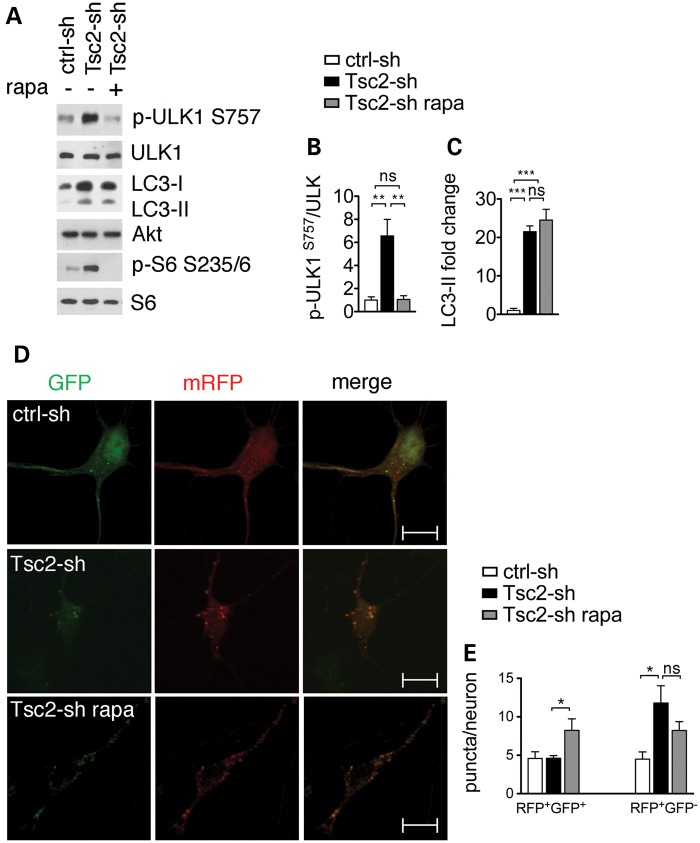
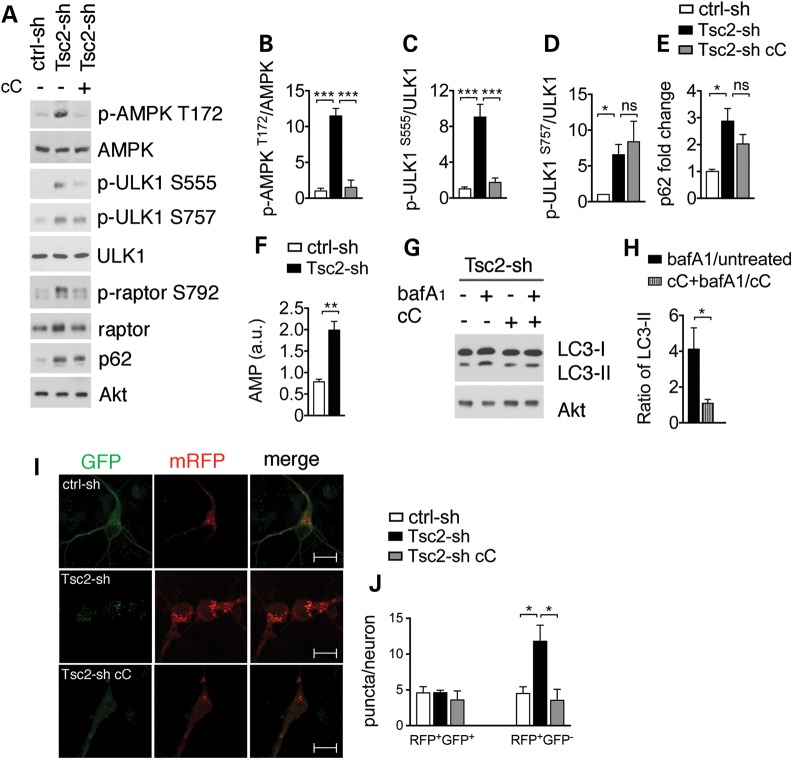
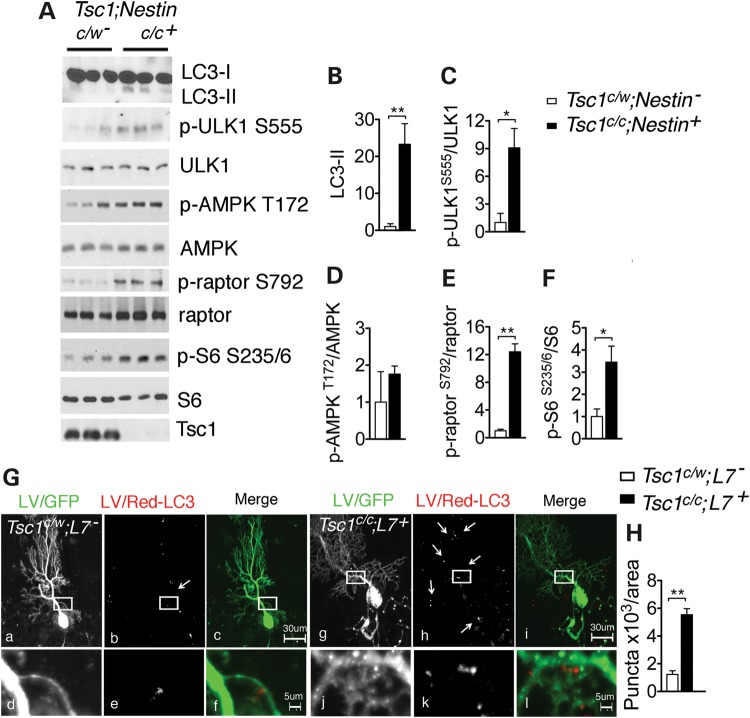
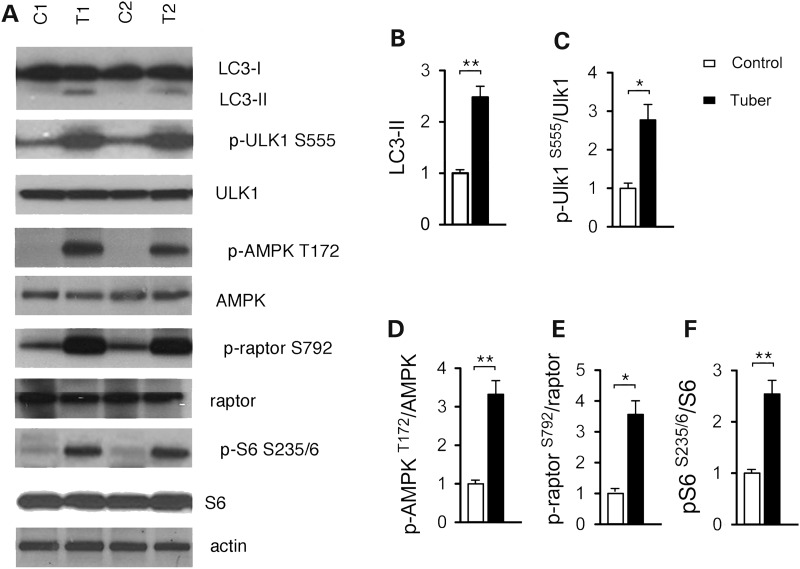
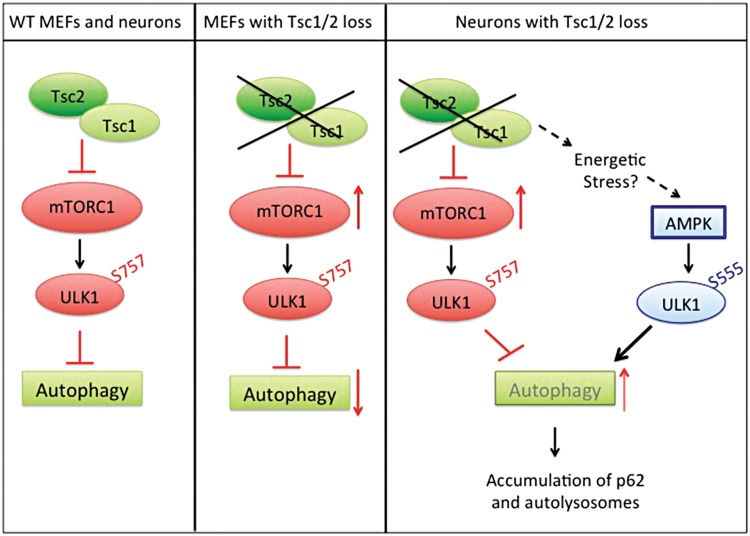
Tuberous sclerosis complex (TSC) is a disorder arising from mutation in the TSC1 or TSC2 gene, characterized by the development of hamartomas in various organs and neurological manifestations including epilepsy, intellectual disability and autism. TSC1/2 protein complex negatively regulates the mammalian target of rapamycin complex 1 (mTORC1) a master regulator of protein synthesis, cell growth and autophagy. Autophagy is a cellular quality-control process that sequesters cytosolic material in double membrane vesicles called autophagosomes and degrades it in autolysosomes. Previous studies in dividing cells have shown that mTORC1 blocks autophagy through inhibition of Unc-51-like-kinase1/2 (ULK1/2). Despite the fact that autophagy plays critical roles in neuronal homeostasis, little is known on the regulation of autophagy in neurons. Here we show that unlike in non-neuronal cells, Tsc2-deficient neurons have increased autolysosome accumulation and autophagic flux despite mTORC1-dependent inhibition of ULK1. Our data demonstrate that loss of Tsc2 results in autophagic activity via AMPK-dependent activation of ULK1. Thus, in Tsc2-knockdown neurons AMPK activation is the dominant regulator of autophagy. Notably, increased AMPK activity and autophagy activation are also found in the brains of Tsc1-conditional mouse models and in cortical tubers resected from TSC patients. Together, our findings indicate that neuronal Tsc1/2 complex activity is required for the coordinated regulation of autophagy by AMPK. By uncovering the autophagy dysfunction associated with Tsc2 loss in neurons, our work sheds light on a previously uncharacterized cellular mechanism that contributes to altered neuronal homeostasis in TSC disease.


Figures

Figure 1.
Figure 1.
Loss of Tsc1/2 in neurons results in accumulation of the autophagic marker LC3-II and autophagic organelles. (A) Representative western blot of LC3-II and p62 in wild-type (WT) and Tsc1−/− MEFs and in rat hippocampal neurons (D) transduced with control (ctrl-sh) and with Tsc2-sh lentivirus. S6 phosphorylation at Ser235/236 (p-S6) indicates mTORC1 activation. Densitometric quantification of LC3-II (MEFs in (B) n = 4; neurons in (E) n = 3) and p62 (MEFs in (C) n = 4; neurons in (F) n = 5) normalized to total Akt. Experiments performed on independent culture preparations. (G) Tsc2-sh neurons transduced with LV/Red-LC3 virus display accumulation of red puncta. Immunofluorescent analysis of LV/Red-LC3 (in red) and mTORC1 activation identified by p-S6 antibody staining (in green) in ctrl-sh and in Tsc2-sh neurons. Scale bar is 10 μm. (H) Quantification of the percentage of neurons with red puncta (n = 4; 20–60 neurons/exp.). *P < 0.05; **P < 0.01; ***P < 0.001). (I) Representative EM images from control and Tsc2-sh cultures. Scale bar is 500 nm. (J) Quantification of organelles with double membrane vesicles/EM field (50 μm2). A total of 51 control and 52 Tsc2-sh neurons were imaged and analyzed (***P < 0.001). (K) Western blot of LC3-II in ctrl-sh and Tsc2-sh neurons untreated or treated with 400 nm bafilomycin (bafA1) for 4 h. (L) Densitometry quantification of LC3-II ratio (bafA1 treated/untreated) in ctrl-sh and Tsc2-sh cultures normalized to total Akt (n = 4, *P < 0.05). (M) Densitometry quantification of LC3-II level (a.u.) in untreated and bafA1-treated neurons. (n = 6, *P < 0.05). Bars represent mean ± s.e.m.
Figure 2.
Figure 2.
Tsc2-sh neurons have mTORC1-dependent inhibition of ULK1 at S757 and mTORC1-independent accumulation of autolysosomes. (A) Representative western blot of ULK1 and LC3-II regulation in ctrl-sh and Tsc2-sh neurons untreated or treated with 20 nm rapamycin (rapa) for 24 h. Effective mTORC1 inhibition by rapamycin treatment is shown by reduced pS6 phosphorylation at S235/6. Densitometry quantification of p-ULK1 S757 (n = 4) normalized to total ULK1 (B) and LC3-II (n = 3) normalized to total Akt (C) (**P < 0.01; ***P < 0.001). (D) Expression of the td-tag-LC3 vector in control and in Tsc2-sh neurons untreated or treated with 20 nm rapamycin (rapa) for 24 h. Scale bar is 10 μm (E) Quantification of the number of RFP+/GFP+ puncta (autophagosomes) per neurons or RFP+/GFP− puncta (autolysosomes) per neurons (n ≥ 3, *P < 0.05). Bars represent mean ± s.e.m.
Figure 3.
Figure 3.
Tsc2-sh neurons have AMPK-dependent ULK1 activation and autolysosome accumulation. (A) Representative western blot of ULK1 and AMPK regulation in ctrl-sh and Tsc2-sh neurons untreated or treated with 5 μm cC for 3 h. Quantification of p-AMPK (T172) (n = 3) (B), p-ULK1 S555 (n = 5) (C), p-ULK1 S757 (n = 4) (D) and p62 (n = 3) (E). (F) Quantification of AMP level by LC–MC analysis in ctrl-sh and Tsc2-sh neurons (n = 4, **P < 0.01). (G) Western blot of LC3-II in ctrl-sh and Tsc2-sh neurons untreated or treated with 400 nm bafilomycin (bafA1) for 4 h in the presence or in the absence of cC. (H) Densitometry quantification of LC3-II ratio (bafA1 treated/untreated) versus cC+ bafA1/cC. (I) Expression of the td-tag-LC3 vector in control and in Tsc2-sh neurons untreated or treated with cC. Scale bar is 10 μm. (J) Quantification of the RFP+/GFP+ puncta and the RFP+/GFP− puncta per neuron. *P < 0.05; **P < 0.01; ***P < 0.001. Bars represent mean ± s.e.m. (n ≥ 3).
Figure 4.
Figure 4.
LC3-II increase in brain tissue of TSC mouse models. (A) Western blot of LC3-II, ULK1 and AMPK activity in protein lysates from P0 brains of control Tsc1c/w;Nestin and mutant Tsc1c/c;Nestin mice. Loss of Tsc1/2 complex and high mTORC1 activity are demonstrated by reduced expression of the Tsc1 protein and increased p-S6 at S235/6 in the mutant mice. Quantification of the western blots by densitometry analysis. LC3-II (B) and p-S6 S235/6 (F) values were expressed as fold change normalized to total S6 level; p-ULK1 S555 (C), p-AMPK T172 (D) and p-raptor (S792) (E) were normalized to the respective total protein bands (n = 3–6 mice/group *P < 0.05, **P < 0.01). (G) Representative confocal images of control Tsc1c/w;L7 (a–f) and mutant Tsc1c/c;L7 (g–l) mice injected with LV/GFP and LV/Red-LC3. GFP-fluorescence was used to identify injected PC. White boxes indicate zoom area in the controls (d–f) and in the mutant mice (j–l). GFP-positive PC of mutant mice display discrete LV/Red-LC3 puncta. Scale bars are 30 μm in top row and scale bar is 5 μm in bottom row. (H) Quantification of the number of LV/Red-LC3 puncta in area unit of 103 μm2 (n = 3 mice/group, **P < 0.01).
Figure 5.
Figure 5.
Autophagy in cortical tubers of TSC patients. (A) Representative western blots of LC3-II, ULK1 and AMPK activation in protein lysates from control brain (C1 and C2) and cortical tubers (T1 and T2). (BF) Quantification of the western blots by densitometry analysis. LC3-II (B) was normalized to actin; p-ULK1 S555 (C), p-AMPK T172 (D), p-raptor (S792) (E) and p-S6 S235/6 (F) were normalized to the respective total protein bands. Values were expressed as fold change relative to control levels (n = 4 samples/group; *P < 0.05, **P < 0.01). Bars represent mean ± s.e.m.
Figure 6.
Figure 6.
Model for regulation of autophagy in the Tsc2-sh neurons. In wild-type cells, Tsc1/2 complex keeps mTORC1 under control and allows autophagy. In fibroblasts, when Tsc1/2 complex activity is lost, mTORC1 activation inhibits autophagy via ULK1 phosphorylation at S757. Neuronal Tsc1/2 complex allows autophagy by acting as a checkpoint on mTORC1. Prolonged Tsc1/2 complex loss causes a buildup of neuronal stress providing a positive feedback on autophagy via AMPK-dependent activation of ULK1 by phosphorylation at S555. Dysfunctional autophagy leads to accumulation of the autophagic substrate p62 and of autolysosomes.

References

    1. Han J.M., Sahin M. TSC1/TSC2 signaling in the CNS. FEBS Lett. 2011;585:973–980. - PMC - PubMed
    1. Tsai P., Sahin M. Mechanisms of neurocognitive dysfunction and therapeutic considerations in tuberous sclerosis complex. Curr. Opin. Neurol. 2011;24:106–113. - PMC - PubMed
    1. Huang J., Manning B.D. A complex interplay between Akt, TSC2 and the two mTOR complexes. Biochem. Soc. Trans. 2009;37:217–222. - PMC - PubMed
    1. Inoki K., Li Y., Zhu T., Wu J., Guan K.L. TSC2 is phosphorylated and inhibited by Akt and suppresses mTOR signalling. Nat. Cell Biol. 2002;4:648–657. - PubMed
    1. Arsham A.M., Neufeld T.P. Thinking globally and acting locally with TOR. Curr. Opin. Cell Biol. 2006;18:589–597. - PubMed

Publication types

MeSH terms

Substances