. 2014 Mar 5;34(10):3719-32.
doi: 10.1523/JNEUROSCI.4206-13.2014.

Heteromeric Kv7.2/7.3 channels differentially regulate action potential initiation and conduction in neocortical myelinated axons

Affiliations

Heteromeric Kv7.2/7.3 channels differentially regulate action potential initiation and conduction in neocortical myelinated axons

Arne Battefeld et al. J Neurosci. .

Abstract

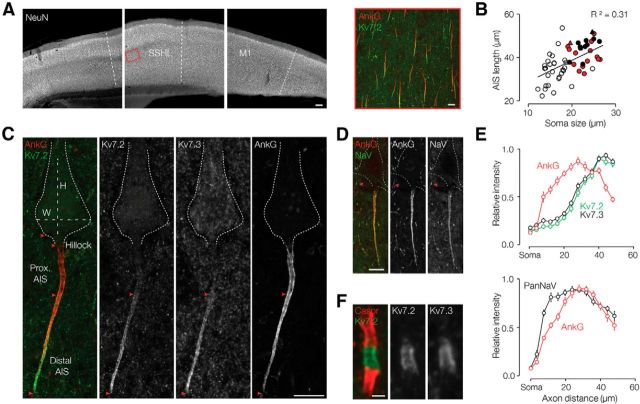
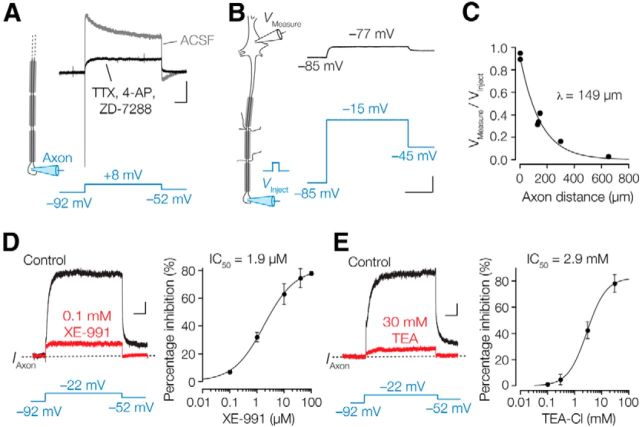
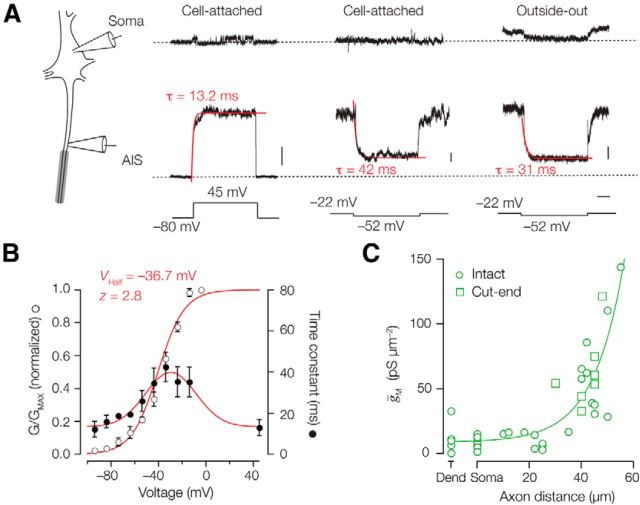
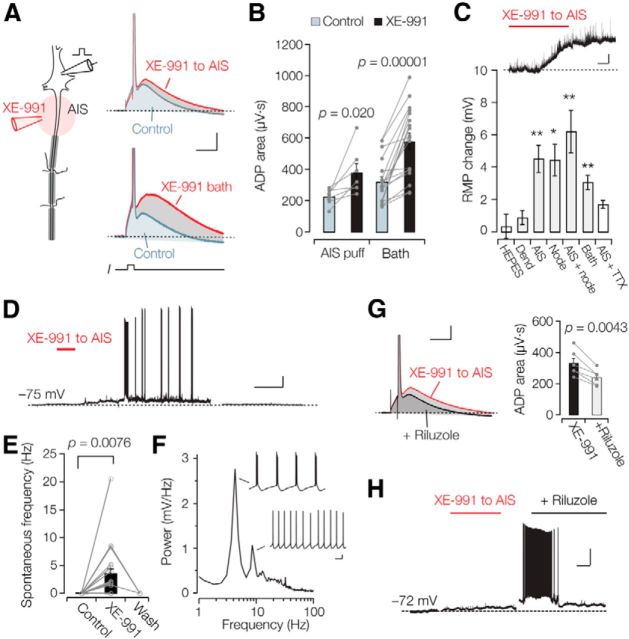
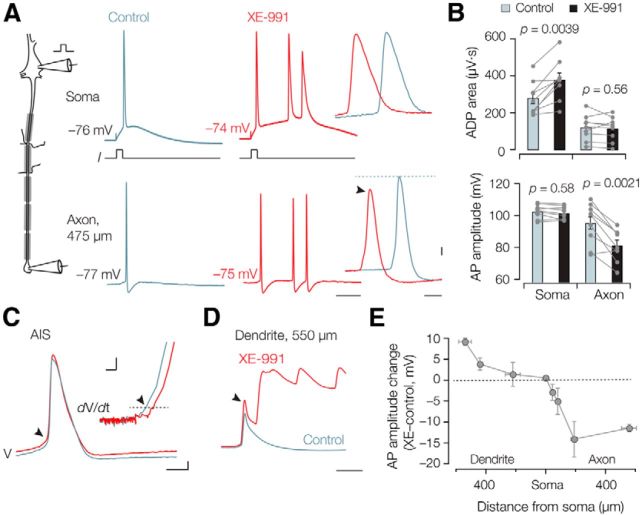
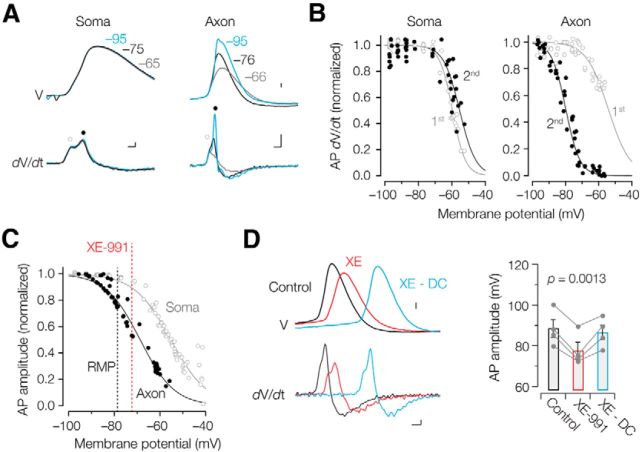
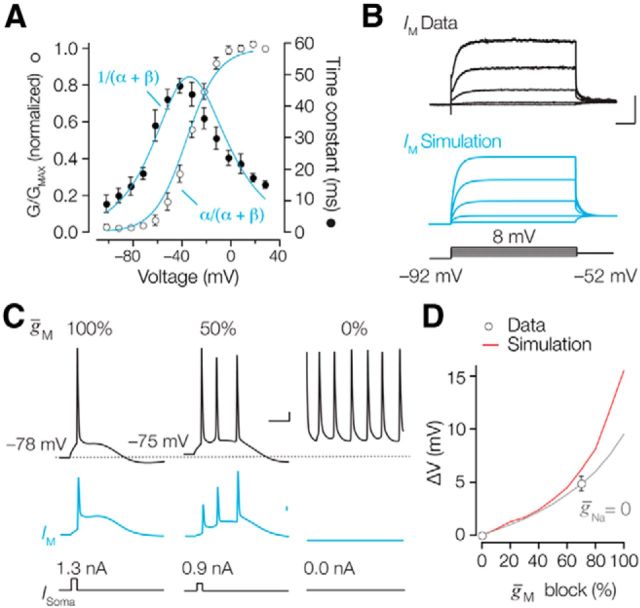
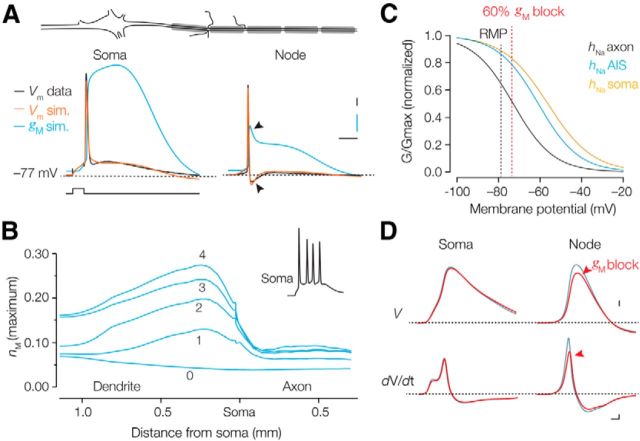
Rapid energy-efficient signaling along vertebrate axons is achieved through intricate subcellular arrangements of voltage-gated ion channels and myelination. One recently appreciated example is the tight colocalization of K(v)7 potassium channels and voltage-gated sodium (Na(v)) channels in the axonal initial segment and nodes of Ranvier. The local biophysical properties of these K(v)7 channels and the functional impact of colocalization with Na(v) channels remain poorly understood. Here, we quantitatively examined K(v)7 channels in myelinated axons of rat neocortical pyramidal neurons using high-resolution confocal imaging and patch-clamp recording. K(v)7.2 and 7.3 immunoreactivity steeply increased within the distal two-thirds of the axon initial segment and was mirrored by the conductance density estimates, which increased from ~12 (proximal) to 150 pS μm(-2) (distal). The axonal initial segment and nodal M-currents were similar in voltage dependence and kinetics, carried by K(v)7.2/7.3 heterotetramers, 4% activated at the resting membrane potential and rapidly activated with single-exponential time constants (~15 ms at 28 mV). Experiments and computational modeling showed that while somatodendritic K(v)7 channels are strongly activated by the backpropagating action potential to attenuate the afterdepolarization and repetitive firing, axonal K(v)7 channels are minimally recruited by the forward-propagating action potential. Instead, in nodal domains K(v)7.2/7.3 channels were found to increase Na(v) channel availability and action potential amplitude by stabilizing the resting membrane potential. Thus, K(v)7 clustering near axonal Na(v) channels serves specific and context-dependent roles, both restraining initiation and enhancing conduction of the action potential.

Keywords: Kv7; axon; excitability.


Figures

Figure 1.
Figure 1.
Kv7 and Nav channels are expressed in nonidentical gradients along neocortical pyramidal neuron AISs and colocalize at nodes of Ranvier. A, Left, At low magnification, NeuN labeling reveals the laminar neocortical structure in a parasagittal brain slice. Somatosensory hindlimb (SSHL) and primary motor (M1) areas are indicated. Scale bar, 100 μm. Right, The L5 somatosensory region (red box, left) is shown at higher magnification, immunolabeled for ankyrin G (AnkG; red) and Kv7.2 (green). Scale bar, 10 μm. B, AIS length is positively correlated with soma size [(height + width)/2]. Least-squares fit shows a positive correlation (R2 = 0.31; fit equation: LAIS = 0.98 (soma size) + 19.082). Red triangle, neuron shown in C; black triangle, neuron shown in D; red circles, set of larger neurons used to plot Kv7.2 and Kv7.3 labeling intensity vs axon distance (shown in E, top); closed circles, larger neurons used to plot PanNav labeling intensity vs axon distance (E, bottom); open circles, smaller neurons that were not included in length measurements. C, Maximal projection image of a large L5 somatosensory neuron, colabeled for Kv7.2, Kv7.3, and ankyrin G. The somatic height (H) and width (W), origin and end of the hillock, proximal AIS, and distal AIS are indicated. Both Kv7 channel subunits are restricted to the distal AIS, wherein intensity increases in a gradient toward the tip. Scale bar, 10 μm. D, Maximal projection image of a large L5 somatosensory neuron, colabeled for ankyrin G and PanNav. The AIS pattern of PanNav (detecting all neuronal Nav channel isoforms) and ankyrin G appear similar. Arrowheads indicate one of many nodes of Ranvier visible in the image (PanNav labeling the unmyelinated node, ankyrin G labeling the node and flanking paranodes). Scale bar, 10 μm. E, Plots of AIS relative labeling intensity vs distance from the axonal origin. Top, Kv7.2 and Kv7.3 labeling profiles are similar: low in the proximal one-third and increasing progressively toward the distal AIS tip (n = 15). Bottom, Ankyrin G and PanNav label the entire AIS, with a broad intensity peak near the midpoint (n = 10). Points show the mean ± SEM of pixel intensity in fractional distance bins along the AIS. F, High-magnification image of a larger node of Ranvier within the L5 somatosensory cortex. Kv7.2 and Kv7.3 colabel the nodal membrane flanked by Caspr at the paranodes. Scale bar, 1 μm.
Figure 2.
Figure 2.
Kv7.2 and Kv7.3 colocalize at AISs and nodes of Ranvier of functionally identified L5 pyramidal neurons. A, Top, z-projected confocal images of the soma and AIS morphology (red, Alexa Fluor 488 fill) and immunofluorescence staining of Kv7.2 (cyan) and Kv7.3 (green) in RS and IB neurons. White arrows indicate the region of the Kv7 immunostaining. Images are background subtracted and pseudo-colored. Scale bars, 10 μm. Bottom, Nodes of Ranvier (NoR) indicated by axonal bifurcation points of identified RS and IB neurons. White arrows indicate positive staining for Kv7.2/7.3 at the NoR. Scale bars, 3 μm. B, Example of a regular firing neuron that was converted into intrinsic burst firing during bath application of XE-991 (red). Calibration: 0.1 s, 20 mV. C, Scatter and bar plots of RS and IB groups show a similar increase in high-frequency action potentials after application of 20 μm XE-991. Scatter plot, Individual experiments. Bars represent mean ± SEM.
Figure 3.
Figure 3.
Isolation and pharmacological characterization of IM in neocortical axons. A, Left, Pipette configuration during single electrode whole-axon voltage-clamp recording. Right, Voltage steps to 8 mV evoked a Na+-mediated fast inward current followed by a large inactivating outward current (gray). In the presence of TTX, 4-AP, and ZD-7288 (black) a slow-activating outward current remained. Calibration: 0.5 nA, 0.1 s. B, Left, Schematic depicting a dual whole-cell recording from soma and axon. Right, Voltage-clamp command steps in the axon (blue traces) were attenuated at the soma (current-clamp, black) to 83%. Calibration: 20 mV, 0.2 s. C, Voltage attenuation plotted vs the distance from the soma and fitted with the exponential function; y = 0.92e−0.0067x. D, E, The Kv7 channel blocker XE-991 (D) and the nonspecific blocker TEA (E) blocked the outward currents. Calibration: 50 pA, 0.1 s. Dose–response curves and corresponding Hill fits to the percentages of current block for XE-991 (n = 18) and TEA (n = 12), respectively. Symbols represent the mean ± SEM.
Figure 4.
Figure 4.
Voltage dependence, kinetics, and retigabine sensitivity of nodal M-currents. A, Deactivation currents under control conditions (left) and in the presence of retigabine (right). Traces represent average of five different axons. Calibration: 20 and 100 pA, 0.1 s. B, IM activation in response to six voltage steps (left). Current traces (average of three axons) of IM to the same voltage steps recorded in the presence of 10 μm retigabine (right). Calibration: 0.1 nA; same time scale applies as in A. Single exponential fits (red) of the current rise time are overlaid only for the maximal activated current. C, Current–voltage plots of the peak current amplitude obtained during activation in control, retigabine, and XE-991. D, Normalized conductance–voltage plots fitted with Boltzmann equations with offset for control and in the presence of retigabine. The half-maximum activation and effective valences are indicated. E, Time constants of activation and deactivation obtained from monoexponential fits are shown. IM was significantly slower between −132 and −42 mV in the presence of retigabine. All symbols represent the mean ± SEM.
Figure 5.
Figure 5.
Voltage dependence, kinetics, and current density of IM in the AIS. A, Left, Schematic drawing indicating the different recording positions at the L5 soma and AIS. Right, Putative M-currents obtained in cell-attached and outside-out recordings from the soma (top) and axon initial segment (middle). Voltage-clamp step protocols are indicated at the bottom. Traces represent the average of >5 trials for each single patch. Currents obtained at the AIS were fit with single exponential functions (red). Calibrations: 5, 1, and 5 pA, respectively; 100 ms. B, For three outside-out patch recordings, voltage steps were obtained for a large voltage range between −92 and −2 mV. The 45 mV data were obtained from the cell-attached recordings. Time constants (closed circles) fitted to a Gaussian function (y = 13.4 + 26.3 e [−((x − 29.7)/30.3)2]). Steady-state voltage dependence of activation (open circles) fit with a single-power Boltzmann function with the indicated parameters. Symbols represent the mean ± SEM. C, Subcellular conductance density distribution along the AIS and somatodendritic membrane. Recordings from intact AIS (open circles) and cut-end AIS (open squares) were combined and fit with an exponential function, y = 8.7 + 1.1 e−0.086 x. Dend, Dendrite.
Figure 6.
Figure 6.
Axonal Kv7 channels maintain resting membrane potential stability. A, Left, Schematic drawing of the drug application (red) and recording pipette arrangement (black). In this example, XE-991 was focally applied to the AIS. Right, Example voltage recordings before (gray) and after XE-991 application (red) locally to the AIS (right top) or in the bath (right bottom) show an augmentation of the ADP. Calibration: 10 ms, 10 mV. B, Line and scatter plots of the individual data reveal an increase in the ADP after local XE-991 application to the AIS (n = 6) or global block in the bath (n = 18). C, Population data of the resting membrane potential change for the different locations and solutions. HEPES, Control solution without XE-991 to the AIS; Dend, XE-991 to the dendrite; AIS, XE-991 to the axon initial segment; Node, XE-991 to the node; AIS + first node, XE-991 to the AIS and node; Bath, XE-991 in the bath; AIS + TTX, XE-991 to the axon initial segment in the presence of 1 μm TTX. **p < 0.001, *p < 0.05. Data represent the mean ± SEM. Inset, Focal AIS application of XE-991 depolarized the resting membrane potential. Calibration: 1 mV, 1 min. D, Example of a recording in which 20 μm XE-991 caused spontaneous firing. A 20 min period before washout was blanked for clarity. Calibration: 4 min, 10 mV. E, Summary data for the 17 experiments in which 10–20 μm was focally applied to the AIS. Washout was tested in three experiments. F, Power spectrum of the spontaneous action potential firing rate during AIS Kv7 channel block. Action potential frequencies ranged between ∼4 and 38 Hz (n = 6). Calibration: 0.1 s, 10 mV. G, After local XE-991 application to the AIS blocking the persistent sodium current by bath application of 5 μm riluzole decreased the ADP (left). Calibration: 10 mV, 10 ms. Population data for the changes of the ADP area during XE-991 application to the AIS and in the presence of riluzole (right). The XE-991 data is the same as in B. H, Recording in which XE-991 puffing to the AIS caused spontaneous firing and application of 5 μm riluzole abolished the spontaneous APs. Gaps in the recording are blanked for clarity. Calibration: 2 min, 20 mV.
Figure 7.
Figure 7.
Kv7 channels differentially regulate back-propagating and forward-propagating action potentials. A, Left, Schematic of the simultaneous soma–axon whole-cell recording. Right, Action potentials evoked by brief (3 ms) somatic current injection simultaneously recorded at an axonal recording distance of 475 μm in control condition (gray) and after bath application of XE-991 (10 μm, red). Note the additional high-frequency spikes in the presence of XE-991. Calibration: 10 ms. High magnification of the same traces shows the reduced axonal action potential amplitude (arrow). Calibration: 0.5 ms, 10 mV. B, Bar graphs and individual experiments of the area under the curve reveal an increase in the somatic ADP (n = 9) after XE-991 application but decrease in the distal axons (>150 μm, n = 9). C, Action potentials were evoked at the soma and simultaneously recorded from the AIS. The AIS action potential threshold was significantly increased (n = 5, p = 0.022, arrow). Inset, The phase plot (time derivative vs voltage) highlighting the voltage threshold. Calibration: 0.5 ms, 10 mV (inset: 5 mV, 0.1 kV s−1). D, XE-991 block in the dendrite increased the action potential amplitude (arrow). In this example, the dendrite generated a long-lasting plateau depolarization associated with high-frequency burst firing at the soma. Calibration: 10 ms, same voltage scaling as in C. E, Summary data of all dual whole-cell recordings (n = 25) showing the location dependence of action potential change in XE-991. Action potential amplitudes increase in the distal dendrite, are maintained at the soma, but are substantially reduced in the axon. Symbols represent x and y mean ± SEM.
Figure 8.
Figure 8.
Voltage dependence of action potentials at somatic and axonal locations. A, Top, Voltage dependence of the somatic (left) and axonal action potential amplitude (right) assessed by applying local positive (gray) and negative holding currents (blue). Action potentials evoked from the resting membrane potential (RMP) are indicated in black. Calibration: 10 mV. Bottom, First derivatives of the voltage corresponding to the above-displayed action potentials. Circles indicate the first (open circle) and second peaks (closed circle), respectively. Calibration: 100 μs, 0.1 kV s−1 (left); 100 μs, 0.5 kV s−1 (right). B, Peak amplitudes of the first and second component of the time derivative separately fit with Boltzmann equations. Note the hyperpolarized inactivation at axonal sites compared with the soma. C, Data from two example recordings reveal a ∼20 mV difference in the midpoint of inactivation of action potential amplitudes between axons (black) and soma (gray). Data were fit with Boltzmann equations (lines). The resting membrane potential in control (black) and in 10–20 μm XE-991 (red) are indicated as dotted lines. D, The reduced axonal action potential amplitude after XE-991 application can be recovered by direct negative current injections (top, blue). Calibration: 10 mV. Corresponding differentiated voltage of the action potentials (bottom) and summary data (mean ± SEM) for four similar experiments (right). Calibration: 100 μs, 0.1 kV s−1.
Figure 9.
Figure 9.
Simulation of Im in the NEURON model. A, Steady-state activation (open circles) and time constants (closed circles) of axonal Im fit with a Hodgkin-Huxley model (blue). B, Top, average of five experimental whole-axon recordings. Middle, Simulated Kv7 currents activated during a single-electrode voltage-clamp simulation (SEClamp) in NEURON (blue). Bottom, Voltage command protocol for simulation and experiments. Calibration: 100 ms, 100 pA. C, Reducing the Kv7 peak conductance density by 50% (middle) and 100% (right) in the model replicates the experimental XE-991 block (compare Figs. 6 and 7). Blue traces represent the activated Im for the different conditions. Calibration: 10 mV, 10 ms (top); 1 mA/cm2 (middle). D, Summary data showing the effect of reducing M on the simulated resting membrane potential in control conditions (red line) and without sodium conductance (gray line) overlaid with experimentally observed resting potential change (circles). Symbols represent the mean ± SEM.
Figure 10.
Figure 10.
Voltage and site dependence of Kv7 activation and sodium channel inactivation. A, Top, Schematic of the neuron model. Bottom, Voltage traces of the soma and a node (620 μm distance from the soma). Recorded (black) and simulated (orange) action potential waveforms at soma and node overlaid with the corresponding time course of gM (blue). Arrows at the axonal traces indicate the strong afterhyperpolarization and reduction of gM due to Kv1 activation. Calibration: 5 ms, 10 mV, 1% (blue). B, Space plot of the maximum gM activation along the dendrosomatic–axonal axis during the resting membrane potential (0) and during action potentials (1–4). Inset, Voltage–time plot of the action potentials (170 Hz) in the soma. gM has the highest degree of activation in the proximal dendrite, but the least in the axon. C, Steady-state sodium inactivation curves used for soma (black), AIS (blue), and axon (orange). Dotted vertical lines indicate the resting membrane potential (black) and 70% block of gM (red). D, Simulated somatic and nodal action potentials in control (gray) and during 70% block of gM (red). Note the selective reduction in action potential rate of rise and amplitude at the node. Calibration: 10 mV (top); 100 V/s, 100 μs (bottom).

Comment in

References

    1. Adams PR, Brown DA, Constanti A. M-currents and other potassium currents in bullfrog sympathetic neurones. J Physiol. 1982;330:537–572. - PMC - PubMed
    1. Barrett EF, Barrett JN. Intracellular recording from vertebrate myelinated axons: mechanism of the depolarizing afterpotential. J Physiol. 1982;323:117–144. - PMC - PubMed
    1. Biervert C, Schroeder BC, Kubisch C, Berkovic SF, Propping P, Jentsch TJ, Steinlein OK. A potassium channel mutation in neonatal human epilepsy. Science. 1998;279:403–406. doi: 10.1126/science.279.5349.403. - DOI - PubMed
    1. Bradke F, Fawcett JW, Spira ME. Assembly of a new growth cone after axotomy: the precursor to axon regeneration. Nat Rev Neurosci. 2012;13:183–193. doi: 10.1038/nrn3176. - DOI - PubMed
    1. Brown DA, Adams PR. Muscarinic suppression of a novel voltage-sensitive K+ current in a vertebrate neurone. Nature. 1980;283:673–676. doi: 10.1038/283673a0. - DOI - PubMed

Publication types

Substances

LinkOut - more resources