

Instrumental variable methods for causal inference
- PMID: 24599889
- PMCID: PMC4201653
- DOI: 10.1002/sim.6128
Instrumental variable methods for causal inference
Erratum in
- Stat Med. 2014 Nov 30;33(27):4859-60
-
Correction.Stat Med. 2019 Sep 10;38(20):3960. doi: 10.1002/sim.8211. Epub 2019 Jun 27. Stat Med. 2019. PMID: 31379022 No abstract available.
-
Correction.Stat Med. 2020 Sep 10;39(20):2693. doi: 10.1002/sim.8567. Epub 2020 May 22. Stat Med. 2020. PMID: 32441377 No abstract available.
Abstract
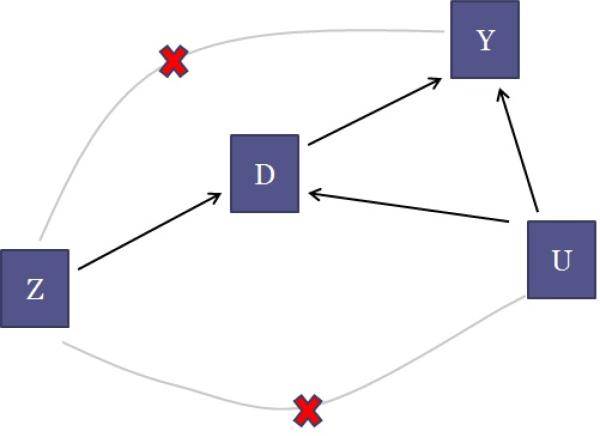
A goal of many health studies is to determine the causal effect of a treatment or intervention on health outcomes. Often, it is not ethically or practically possible to conduct a perfectly randomized experiment, and instead, an observational study must be used. A major challenge to the validity of observational studies is the possibility of unmeasured confounding (i.e., unmeasured ways in which the treatment and control groups differ before treatment administration, which also affect the outcome). Instrumental variables analysis is a method for controlling for unmeasured confounding. This type of analysis requires the measurement of a valid instrumental variable, which is a variable that (i) is independent of the unmeasured confounding; (ii) affects the treatment; and (iii) affects the outcome only indirectly through its effect on the treatment. This tutorial discusses the types of causal effects that can be estimated by instrumental variables analysis; the assumptions needed for instrumental variables analysis to provide valid estimates of causal effects and sensitivity analysis for those assumptions; methods of estimation of causal effects using instrumental variables; and sources of instrumental variables in health studies.
Keywords: comparative effectiveness; confounding; instrumental variables; observational study.
Copyright © 2014 John Wiley & Sons, Ltd.
Figures
Comment in
-
Instrumental variable methods for causal inference: early work and recent developments.Stat Med. 2014 Jul 30;33(17):3058-9. doi: 10.1002/sim.6168. Stat Med. 2014. PMID: 24989339 No abstract available.
References
-
- Rosenbaum P, Rubin D. The central role of the propensity score in observational studies for causal effects. Biometrika. 1983;70(1):41–55.
-
- D'Agostino R., Jr Tutorial in biostatistics: propensity score methods for bias reduction in the comparison of a treatment to a non-randomized control group. Statistics in Medicine. 1998;17:2265–2281. - PubMed
-
- Pearl J. Causality. Cambridge University Press; 2009.
Publication types
MeSH terms
Grants and funding
LinkOut - more resources
Full Text Sources
Other Literature Sources