. 2014 Apr 18;289(16):11497-11511.
doi: 10.1074/jbc.M113.531921. Epub 2014 Mar 5.

Phosphatidic acid (PA)-preferring phospholipase A1 regulates mitochondrial dynamics

Affiliations

Phosphatidic acid (PA)-preferring phospholipase A1 regulates mitochondrial dynamics

Takashi Baba et al. J Biol Chem. .

Abstract

Recent studies have suggested that phosphatidic acid (PA), a cone-shaped phospholipid that can generate negative curvature of lipid membranes, participates in mitochondrial fusion. However, precise mechanisms underling the production and consumption of PA on the mitochondrial surface are not fully understood. Phosphatidic acid-preferring phospholipase A1 (PA-PLA1)/DDHD1 is the first identified intracellular phospholipase A1 and preferentially hydrolyzes PA in vitro. Its cellular and physiological functions have not been elucidated. In this study, we show that PA-PLA1 regulates mitochondrial dynamics. PA-PLA1, when ectopically expressed in HeLa cells, induced mitochondrial fragmentation, whereas its depletion caused mitochondrial elongation. The effects of PA-PLA1 on mitochondrial morphology appear to counteract those of MitoPLD, a mitochondrion-localized phospholipase D that produces PA from cardiolipin. Consistent with high levels of expression of PA-PLA1 in testis, PA-PLA1 knock-out mice have a defect in sperm formation. In PA-PLA1-deficient sperm, the mitochondrial structure is disorganized, and an abnormal gap structure exists between the middle and principal pieces. A flagellum is bent at that position, leading to a loss of motility. Our results suggest a possible mechanism of PA regulation of the mitochondrial membrane and demonstrate an in vivo function of PA-PLA1 in the organization of mitochondria during spermiogenesis.

Keywords: Membrane; Mitochondria; Phosphatidic Acid; Phospholipase A; Sperm.


Figures

FIGURE 1.
FIGURE 1.
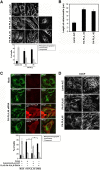
PA-PLA1 regulates mitochondrial dynamics. A, lysates (50 μg each) of different mouse tissues (upper panel) and HeLa cells treated with Lamin A/C siRNA, PA-PLA1 siRNA2, or PA-PLA1 siRNA5 (lower panel) were analyzed by Western blotting with the indicated antibodies. B, HeLa cells were transfected with the empty FLAG plasmid (top), the plasmid encoding FLAG-PA-PLA1 (middle), or the FLAG-PA-PLA1 S537A mutant (bottom). At 24 h after transfection, cells were double stained with antibodies against FLAG and Tom20. Cells expressing FLAG-PA-PLA1 or FLAG-PA-PLA1 S537A mutant are indicated with asterisks. Scale bar, 10 μm. Quantitative data are shown at the bottom. Cells with fragmented mitochondria were counted under a fluorescence microscope. At least 100 cells were analyzed for each sample. Data represent the means ± S.D. for three independent experiments. Error bars represent S.D.
FIGURE 2.
FIGURE 2.
Knockdown of PA-PLA1 induces elongation of mitochondria. A, HeLa cells were treated with the indicated siRNAs for 72 h and subsequently stained with an antibody against Tom20. Higher magnification views of the boxed areas are shown on the right (middle column). Scale bar, 10 μm. Cells were classified according to their mitochondrial morphology: intermediate (mitochondria with tubular structures, which were dominantly observed in control (Lamin A/C-treated) cells (top row, left column)), elongated (most mitochondria were elongated (middle and bottom rows, left column) and aggregated (most mitochondria were aggregated near the nucleus with long tubule extensions to the cell periphery (middle and bottom rows, right column)), and fragmented (most mitochondria were fragmented, and filamentous mitochondria were scarcely found). The bottom graph shows the percentages of cells with the indicated mitochondrial morphologies. Black, gray, and white bars indicate elongated and aggregated, intermediate, and fragmented morphologies, respectively. At least 100 cells were analyzed. Data represent the means ± S.D. for three independent experiments. B, HeLa cells were treated with the indicated siRNAs and stained as in A. The mitochondrial length in the peripheral regions was analyzed as described under “Experimental Procedures”. Twenty randomly selected cells were analyzed for each sample. Data represent the means ± S.D. for three independent experiments. C, HeLa cells were treated with PA-PLA15 siRNA or mock-treated for 48 h and then transfected with the indicated plasmids. At 24 h after transfection with the plasmid, the cells were fixed and stained with antibodies against cytochrome c and FLAG. Scale bar, 10 μm. The bottom graph shows the percentages of cells with the indicated mitochondrial morphologies. Black, gray, and white bars indicate elongated and aggregated, intermediate, and fragmented morphologies, respectively. At least 100 cells were analyzed for each sample. Data represent the means ± S.D. for three independent experiments. *, p < 0.05, Student's t test. D, HeLa cells were treated with the indicated siRNAs as in A and stained after incubation with 10 μm CCCP for 90 min. Scale bar, 10 μm. Error bars represent S.D.
FIGURE 3.
FIGURE 3.
The ectopic expression of PA-PLA1 counteracts that of MitoPLD. A, HeLa cells were double transfected with the following plasmid/construct combinations: MitoPLD-myc and FLAG (top row), MitoPLD-myc and FLAG-PA-PLA1 (middle row), and MitoPLD-myc and FLAG-PA-PLA1 S537A mutant (bottom row). At 24 h after transfection, the cells were stained with MitoTracker Red CMXRos and antibodies against FLAG and myc. Representative images are shown. Scale bar, 10 μm. The graph shows the percentages of cells exhibiting perinuclear aggregation of mitochondria. At least 100 cells were evaluated for each sample. Data represent the means ± S.D. for three independent experiments. *, p < 0.05, Student's t test. B, HeLa cells were triple transfected with the following plasmid/construct combinations: Raf1-PABD-EGFP, pcDNA3, and FLAG (top row); Raf1-PABD-EGFP, pcDNA3, and FLAG-PA-PLA1 (second row); Raf1-PABD-EGFP, MitoPLD-myc, and FLAG (third row); Raf1-PABD-EGFP, MitoPLD H156N-myc, and FLAG (fourth row); Raf1-PABD mutant (mut)-EGFP, MitoPLD-myc, and FLAG (fifth row); Raf1-PABD-EGFP, MitoPLD-myc, and FLAG-PA-PLA1 (sixth row); and Raf1-PABD-EGFP, MitoPLD-myc, and FLAG-PA-PLA1 S537A mutant (bottom row). At 24 h after transfection, the cells were stained with antibodies against FLAG and myc. Representative images are shown. For cells expressing Raf1-PABD-EGFP, MitoPLD-myc, and FLAG (third row) or Raf1-PABD-EGFP, MitoPLD-myc, and FLAG-PA-PLA1 S537A mutant (bottom row), staining patterns of cells in which Raf1-PABD-EGFP is localized to mitochondria are presented. Scale bar, 10 μm. Cells with Raf1-PABD-EGFP on mitochondria were counted, and the quantitative data are shown. At least 100 cells were evaluated for each sample. Data represent the means ± S.D. for three independent experiments. **, p < 0.01, Student's t test. C, quantification of PA and LPA contents by mass spectrometry. HeLa cells were double transfected with the empty FLAG plasmid and pcDNA3, the empty FLAG plasmid and the plasmid encoding MitoPLD-myc, or the plasmid encoding FLAG-PA-PLA1 and pcDNA3. At 24 h after transfection, cells were collected. PA and LPA contents of mitochondrial fractions were measured by mass spectrometry as described under “Experimental Procedures.” Data represent relative intensities normalized by protein amount. The averages of two independent experiments are shown. Error bars represent S.D.
FIGURE 4.
FIGURE 4.
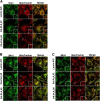
Distributions of Drp1 and Mfn1/2 are not affected by depletion of PA-PLA1. HeLa cells were treated with the indicated siRNAs for 72 h and then double stained with an antibody against Drp1 (A), Mfn1 (B), or Mfn2 (C) and MitoTracker Red CMXRos. Insets are enlarged images of the boxed areas. Scale bar, 10 μm.
FIGURE 5.
FIGURE 5.
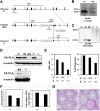
Subfertility of male PA-PLA1−/− mice. A, schematic representation of the wild-type (+), targeted (geo), and knock-out (−) alleles. The lipase consensus sequence SHSLG is encoded in exon 10. Cre-mediated deletion of exon 8 is supposed to cause a frameshift. Exons of the PA-PLA1 gene and loxP sequences are indicated by black boxes and closed triangles, respectively. FRT, Flp recombination target; SA, splice acceptor sequence of mouse engrailed 2; LacZ, β-galactosidase gene; Neor, neomycin resistance gene; pA, SV40 polyadenylation signal. B, Southern blot analysis of EcoRI-digested genomic DNA derived from the wild-type allele (+/+) and heterozygous targeted allele (+/geo). The 5′ probe in A recognized 13- and 16-kb fragments of the wild-type and targeted alleles, respectively. g denotes geo. C, Southern blot analysis of EcoRV-digested genomic DNA from the wild-type (+/+), heterozygous targeted (+/geo), homozygous targeted (geo/geo), heterozygous (+/−), and knock-out (−/−) alleles. The Neo probe in A recognized 3.3- and 20-kb fragments of the targeted and knock-out alleles, respectively. D, testis lysates (100 μg) were analyzed by Western blotting with a monoclonal antibody against PA-PLA1 and an anti-α-tubulin antibody. The bottom panel shows a longer exposure image. E, average litter size and pregnancy rate of PA-PLA1−/− mice. The numbers of matings were 55, 66, and 24 for male +/+, g/g, and −/−, respectively. ♀, female. The average litter sizes were calculated as the number of pups per number of matings. Error bars represent the S.E. for each set of crossing experiments. F, the average number of spermatozoa collected from the cauda epididymis. Data are means ± S.E. (+/+, n = 11; −/−, n = 10) (left graph). Testis weight was normalized as to body weight. Data are means ± S.E. (+/+, n = 9; −/−, n = 9) (right graph). G, H&E staining of seminiferous tubules of testes from PA-PLA1+/+ and PA-PLA1−/− mice. Scale bar, 40 μm.
FIGURE 6.
FIGURE 6.
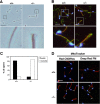
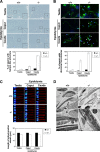
Spermatozoa from PA-PLA1−/− mice are bent at the junction of the middle and principal pieces. A, differential interference contrast images of spermatozoa derived from the cauda epididymis of PA-PLA1+/+ and PA-PLA1−/− mice. The lower row shows enlarged images of the boxed areas in the upper row. Scale bar, 20 μm. B, spermatozoa from the cauda epididymis of PA-PLA1+/+ and PA-PLA1−/− mice were triple stained with Hoechst 33342 (blue), MitoTracker Red CMXRos (red), and anti-α-tubulin antibody (green). The lower row shows enlarged images of the boxed areas in the upper row. Scale bar, 20 μm. C, motility of spermatozoa derived from the cauda epididymis was recorded for 10 s. At least 100 spermatozoa were assessed. The data are the averages for two independent experiments. D, spermatozoa collected from the cauda epididymis of PA-PLA1+/+ and PA-PLA1−/− mice were triple stained with Hoechst 33342 (blue), anti-SEPT4 antibody (green), and mitochondrial membrane potential-sensitive dye MitoTracker Red CMXRos or mitochondrial membrane potential-insensitive dye MitoTracker Deep Red FM (red). Arrows indicate the sites where the MitoTracker staining was absent. Scale bar, 20 μm.
FIGURE 7.
FIGURE 7.
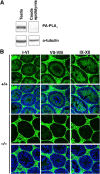
Stage-specific expression of PA-PLA1 during spermatogenesis. A, total protein lysates (50 μg) of testis and cauda epididymis were analyzed by Western blotting. B, testis sections from PA-PLA1+/+ and PA-PLA1−/− mice were double stained with a monoclonal antibody against PA-PLA1 (green) and Hoechst 33342 (blue). Staining patterns of stages I–VI, VII-VIII, and IX–XII of the seminiferous epithelium cycle are shown. The intense staining between seminiferous tubules is due to nonspecific binding of secondary antibody. No staining was observed in PA-PLA1−/− cross-sections (third row), indicating the specificity of the antibody. Scale bars, 40 μm.
FIGURE 8.
FIGURE 8.
PA-PLA1 deficiency produces an abnormal mitochondrial sheath. A, differential interference contrast images of spermatozoa derived from the testis (top row), caput epididymis (middle row), and cauda epididymis (bottom row) of PA-PLA1+/+ and PA-PLA1−/− mice. Insets show enlarged images of the boxed areas. Arrowheads indicate the segment between the mitochondrial sheath and the principal piece. Scale bar, 20 μm. Quantitative data are shown at the bottom. At least 100 spermatozoa were counted for each sample. Data are means ± S.D. (n = 3). B, spermatozoa from PA-PLA1+/+ and PA-PLA1−/− mice were double stained with Hoechst 33342 (blue) and anti-α-tubulin antibody (green). Arrowheads indicate an abnormal microtubule structure. Scale bar, 20 μm. Quantitative data are shown at the bottom. At least 100 spermatozoa were counted for each sample. Data are means ± S.D. (n = 3) C, spermatozoa from PA-PLA1+/+ and PA-PLA1−/− mice were double stained with Hoechst 33342 (blue) and MitoTracker Red CMXRos (red). Images were captured with an Olympus DP70 charge-coupled device camera attached to an Olympus IX70 microscope, and the length of the mitochondrial sheath was determined using ImageJ software. Quantitative data are shown in the bottom graph. Three mice were analyzed for each genotype. For each mouse, 20 spermatozoa were analyzed. Data are means ± S.D. D, spermatozoa from the cauda epididymis of PA-PLA1+/+ and PA-PLA1−/− mice were analyzed by electron microscopy. Upper row scale bar, 2 μm; lower row scale bar, 1 μm. Error bars represent S.D.
FIGURE 9.
FIGURE 9.
Mitochondrial morphology in PA-PLA1−/− MEF cells. MEFs isolated from PA-PLA1+/+ and PA-PLA1−/− mice were stained with an antibody against cytochrome c. Two independent cell lines were analyzed for each genotype.
FIGURE 10.
FIGURE 10.
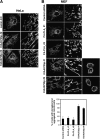
KIAA0725p regulates mitochondrial dynamics in MEFs. HeLa cells (A) or MEFs (B) were treated with the indicated siRNAs for 72 h and subsequently stained with an antibody against cytochrome c. Higher magnification views of the boxed areas are shown on the right. Scale bar, 10 μm. B, quantitative data are shown at the bottom. Cells in which most mitochondria were elongated or aggregated were counted. At least 100 cells were analyzed. Data represent the means ± S.D. for three independent experiments. Error bars represent S.D.

References

    1. Haucke V., Di Paolo G. (2007) Lipids and lipid modifications in the regulation of membrane traffic. Curr. Opin. Cell Biol. 19, 426–435 - PMC - PubMed
    1. Wang X., Devaiah S. P., Zhang W., Welti R. (2006) Signaling functions of phosphatidic acid. Prog. Lipid Res. 45, 250–278 - PubMed
    1. Ha K. D., Clarke B. A., Brown W. J. (2012) Regulation of the Golgi complex by phospholipid remodeling enzymes. Biochim. Biophys. Acta 1821, 1078–1088 - PMC - PubMed
    1. Han G. S., Carman G. M. (2010) Characterization of the human LPIN1-encoded phosphatidate phosphatase isoforms. J. Biol. Chem. 285, 14628–14638 - PMC - PubMed
    1. Shindou H., Hishikawa D., Harayama T., Eto M., Shimizu T. (2013) Generation of membrane diversity by lysophospholipid acyltransferases. J. Biochem. 154, 21–28 - PubMed

Publication types

MeSH terms