Analysis of host gene expression changes reveals distinct roles for the cytoplasmic domain of the Epstein-Barr virus receptor/CD21 in B-cell maturation, activation, and initiation of virus infection
- PMID: 24600013
- PMCID: PMC4019091
- DOI: 10.1128/JVI.03099-13
Analysis of host gene expression changes reveals distinct roles for the cytoplasmic domain of the Epstein-Barr virus receptor/CD21 in B-cell maturation, activation, and initiation of virus infection
Abstract
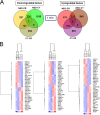
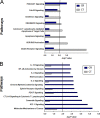
Epstein-Barr virus (EBV) attachment to human CD21 on the B-cell surface initiates infection. Whether CD21 is a simple tether or conveys vital information to the cell interior for production of host factors that promote infection of primary B cells is controversial, as the cytoplasmic fragment of CD21 is short, though highly conserved. The ubiquity of CD21 on normal B cells, the diversity of this population, and the well-known resistance of primary B cells to gene transfer technologies have all impeded resolution of this question. To uncover the role(s) of the CD21 cytoplasmic domain during infection initiation, the full-length receptor (CD21=CR), a mutant lacking the entire cytoplasmic tail (CT), and a control vector (NEO) were stably expressed in two pre-B-cell lines that lack endogenous receptor. Genome-wide transcriptional analysis demonstrated that stable CD21 surface expression alone (either CR or CT) produced multiple independent changes in gene expression, though both dramatically decreased class I melanoma-associated antigen (MAGE) family RNAs and upregulated genes associated with B-cell differentiation (e.g., C2TA, HLA-II, IL21R, MIC2, CD48, and PTPRCAP/CD45-associated protein). Temporal analysis spanning 72 h revealed that not only CR- but also CT-expressing lines initiated latency. In spite of this, the number and spectrum of transcripts altered in CR- compared with CT-bearing lines at 1 h after infection further diverged. Differential modulation of immediate early cellular transcripts (e.g., c-Jun and multiple histones), both novel and previously linked to CD21-initiated signaling, as well as distinct results from pathway analyses support a separate role for the cytoplasmic domain in initiation of intracellular signals.
Importance: Membrane proteins that mediate virus attachment tether virus particles to the cell surface, initiating infection. In addition, upon virus interaction such proteins may transmit signals to the interior of the cell that support subsequent steps in the infection process. Here we show that expression of the Epstein-Barr virus B-cell attachment receptor, CD21, in B cells that lack this receptor results in significant changes in gene expression, both before and rapidly following EBV-CD21 interaction. These changes translate into major signaling pathway alterations that are predicted to support stable infection.
Figures


Similar articles
-
CD21 (Complement Receptor 2) Is the Receptor for Epstein-Barr Virus Entry into T Cells.J Virol. 2020 May 18;94(11):e00428-20. doi: 10.1128/JVI.00428-20. Print 2020 May 18. J Virol. 2020. PMID: 32238579 Free PMC article.
-
EBV attachment stimulates FHOS/FHOD1 redistribution and co-aggregation with CD21: formin interactions with the cytoplasmic domain of human CD21.J Cell Sci. 2004 Jun 1;117(Pt 13):2709-20. doi: 10.1242/jcs.01113. Epub 2004 May 11. J Cell Sci. 2004. PMID: 15138285
-
Human complement receptor type 1/CD35 is an Epstein-Barr Virus receptor.Cell Rep. 2013 Feb 21;3(2):371-85. doi: 10.1016/j.celrep.2013.01.023. Epub 2013 Feb 14. Cell Rep. 2013. PMID: 23416052 Free PMC article.
-
[History of resaerch on Epstein-Barr virus--target cells of infection, and disease].Uirusu. 2014;64(1):67-74. doi: 10.2222/jsv.64.67. Uirusu. 2014. PMID: 25765982 Review. Japanese.
-
Dynamic Epstein-Barr virus gene expression on the path to B-cell transformation.Adv Virus Res. 2014;88:279-313. doi: 10.1016/B978-0-12-800098-4.00006-4. Adv Virus Res. 2014. PMID: 24373315 Free PMC article. Review.
Cited by
-
Capable Infection of Hepatitis B Virus in Diffuse Large B-cell Lymphoma.J Cancer. 2018 Apr 12;9(9):1575-1581. doi: 10.7150/jca.24384. eCollection 2018. J Cancer. 2018. PMID: 29760795 Free PMC article.
-
Multidimensional single-cell analysis identifies a role for CD2-CD58 interactions in clinical antitumor T cell responses.J Clin Invest. 2022 Sep 1;132(17):e159402. doi: 10.1172/JCI159402. J Clin Invest. 2022. PMID: 35881486 Free PMC article.
-
Expression and Function of Tetraspanins and Their Interacting Partners in B Cells.Front Immunol. 2018 Jul 18;9:1606. doi: 10.3389/fimmu.2018.01606. eCollection 2018. Front Immunol. 2018. PMID: 30072987 Free PMC article. Review.
-
Lymphotropic Viruses: Chronic Inflammation and Induction of Cancers.Biology (Basel). 2020 Nov 10;9(11):390. doi: 10.3390/biology9110390. Biology (Basel). 2020. PMID: 33182552 Free PMC article. Review.
-
Recent advances in understanding Epstein-Barr virus.F1000Res. 2017 Mar 29;6:386. doi: 10.12688/f1000research.10591.1. eCollection 2017. F1000Res. 2017. PMID: 28408983 Free PMC article. Review.
References
-
- Rickinson AB, Kieff E. 2007. Epstein-Barr Virus, p 2655–2700 In Knipe DM, Howley PM. (ed), Fields virology, vol 2 Lippincott, Williams & Wilkins, Philadelphia, PA
MeSH terms
Substances
LinkOut - more resources
Full Text Sources
Other Literature Sources
Research Materials
Miscellaneous

