. 2014 May;31(5):1077-88.
doi: 10.1093/molbev/msu088. Epub 2014 Mar 5.

Automated reconstruction of whole-genome phylogenies from short-sequence reads

Affiliations

Automated reconstruction of whole-genome phylogenies from short-sequence reads

Frederic Bertels et al. Mol Biol Evol. 2014 May.

Abstract

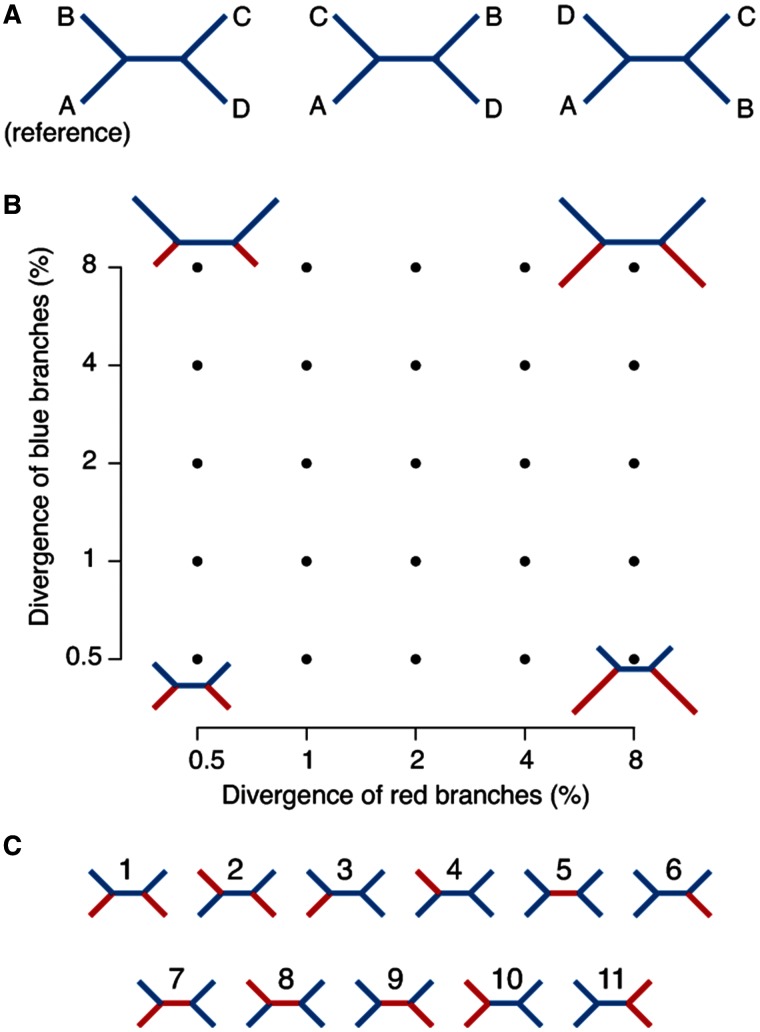
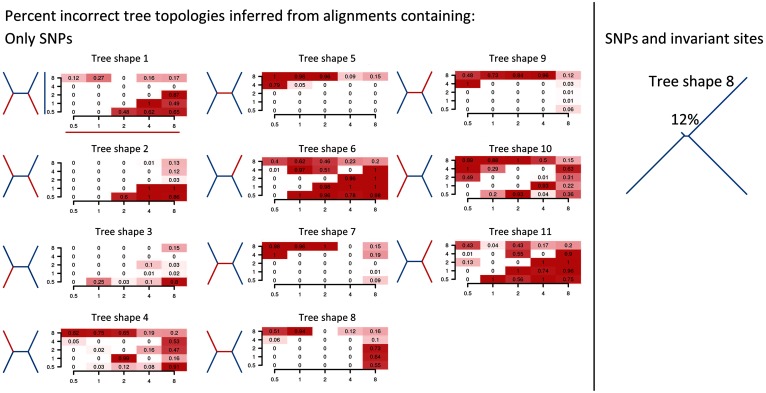
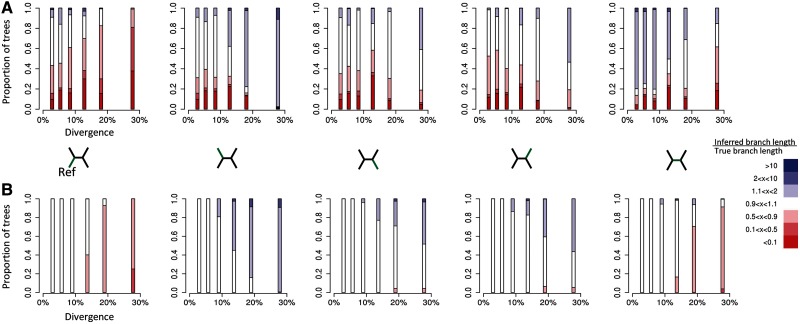
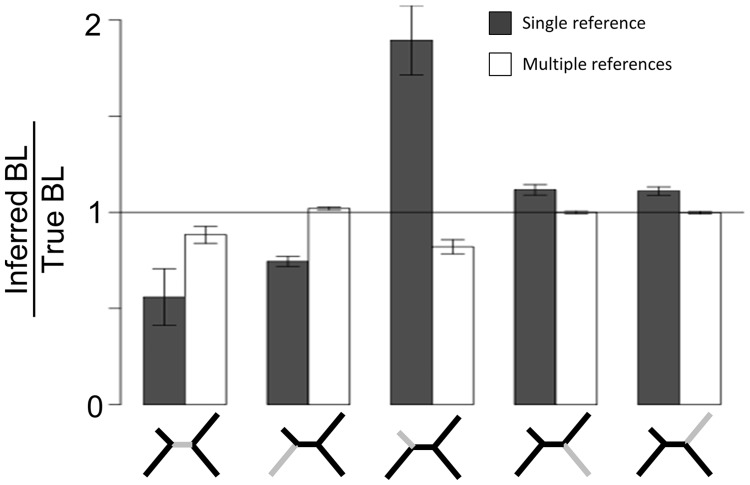
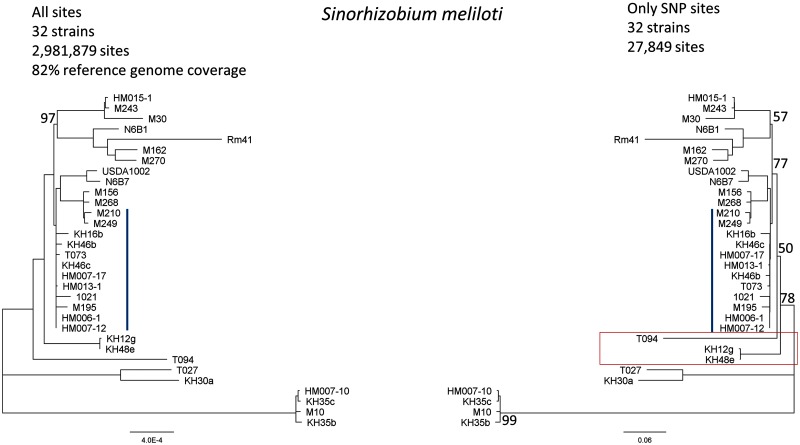
Studies of microbial evolutionary dynamics are being transformed by the availability of affordable high-throughput sequencing technologies, which allow whole-genome sequencing of hundreds of related taxa in a single study. Reconstructing a phylogenetic tree of these taxa is generally a crucial step in any evolutionary analysis. Instead of constructing genome assemblies for all taxa, annotating these assemblies, and aligning orthologous genes, many recent studies 1) directly map raw sequencing reads to a single reference sequence, 2) extract single nucleotide polymorphisms (SNPs), and 3) infer the phylogenetic tree using maximum likelihood methods from the aligned SNP positions. However, here we show that, when using such methods to reconstruct phylogenies from sets of simulated sequences, both the exclusion of nonpolymorphic positions and the alignment to a single reference genome, introduce systematic biases and errors in phylogeny reconstruction. To address these problems, we developed a new method that combines alignments from mappings to multiple reference sequences and show that this successfully removes biases from the reconstructed phylogenies. We implemented this method as a web server named REALPHY (Reference sequence Alignment-based Phylogeny builder), which fully automates phylogenetic reconstruction from raw sequencing reads.

Keywords: Escherichia coli; Pseudomonas syringae; next-generation sequencing.


Figures

F<sc>ig</sc>. 1.
Fig. 1.
Tree shapes and branch lengths used to simulate sequence evolution. (A) The three possible topologies in a four-taxon tree. (B) The sample space of tree topologies. Each axis indicates the divergence along one set of branches: the divergence of the red branches is indicated along the x-axis and the divergence of the blue branches is indicated along the y-axis. We sampled at five points along each axis, that is, at 0.5, 1, 2, 4, and 8% divergence, for a total of 25 different combinations of branch lengths. (C) All possible tree shapes are considered in the analyses. There are 11 total tree shapes in a four-taxon tree that divide the branches into two types (shown here as red and blue). In all our analyses, the reference node is the lower left node of the tree.
F<sc>ig</sc>. 2.
Fig. 2.
Parameter combinations for which incorrect topologies were inferred from mapped alignments excluding (left) and including (right) nonpolymorphic sites (without recombination). Left: Fraction of incorrectly reconstructed trees from a total of 100 replicates for all parameter combinations, inferred only on extracted SNPs. Each panel shows data for a different tree shape. Tree shapes are indicated on the left of each panel. Each heatmap shows the divergence (in percent) of red branches across the x-axis and divergences across blue branches on the y-axis. Right: Tree shape 8 with a divergence of 0.5% along the short branches and 8% along the long branches is shown. The percentage above the tree indicates the proportion of trees (out of 100) for which the incorrect topology was inferred.
F<sc>ig</sc>. 3.
Fig. 3.
Mapping to a single reference introduces alignment biases. Assuming, for illustrative purposes, that the alignment algorithm allows only one mismatch between query and reference within a 21-bp region, each panel shows the maximal number of mutations allowed in order for successful mapping of all orthologous fragments to occur, as a function of the positions in the tree where mutations occur. (A) If a single mutation occurs on the reference branch, then the distance from the reference to all other sequences reaches one immediately, and no further mutations are allowed. (B) One mutation on the internal branch as well as one mutation on the sister branch are allowed before all three query sequences reach a distance of one to the reference. (C) Three independent mutations on each of the external branches are allowed before all query sequences reach a distance of one to the reference.
F<sc>ig</sc>. 4.
Fig. 4.
Deviation of relative branch lengths, as inferred from mapped sequence alignments, from the true relative branch lengths for (A) phylogenies inferred using SNP positions only and (B) phylogenies inferred using all positions. For each branch in our simulated four-taxon trees, the figure shows the proportion of trees in which the estimated relative branch length deviated from the true relative branch length to a certain degree (color).The trees were subdivided into six equally sized bins based on the overall divergence level (proportion of columns within the original multiple sequence alignment that contain SNPs) and the branch length ratios were calculated for each divergence class (position on the x-axis). The proportion of trees inferred from mapped sequence alignments that contain relative branch lengths that are more than ten times greater than those from the true tree are shown in dark blue. Relative branch lengths that are more than ten times shorter are shown in dark red. Relative branch lengths that are within 10% of the true branch length are shown in white (see legend). The figure shows one plot for each of the five branches within the tree (this branch is indicated in green in the four-taxon trees between A and B). The reference sequence is always the taxon on the bottom left of the tree. Trees were only included in the statistics if the mapped tree topology matched the true (known) tree topology.
F<sc>ig</sc>. 5.
Fig. 5.
Accuracy of estimated relative branch lengths when inferring a phylogeny from a single reference alignment (gray bars) and from a merged alignment of all four references (white bars). The relative branch length (BL) of a particular branch is defined as the length of the branch divided by the sum of all BLs in the tree. The BL ratio is the ratio of the estimated BL and the BL of the true tree. The bars show the BL ratios for each of the five branches (indicated at the bottom) of the trees inferred in 88 independent trials (all correctly reconstructed topologies) of alignments from tree shape eight with divergences of 0.5% and 8%. Note that the closer the bars are to one, the more similar the estimated tree is to the true tree.
F<sc>ig</sc>. 6.
Fig. 6.
Comparison of REALPHY phylogenies to phylogenies inferred in previous publications. Both REALPHY trees (green) were built using PhyML, with the general time-reversible (GTR) model of nucleotide evolution and gamma distributed rate variation. The annotation on the branch points in black denotes the bootstrap support for the branch points from a total of 100 bootstrap experiments (only shown if <100) for REALPHY trees, Bayesian probabilities for the Baltrus tree (shown if <0.95) and bootstrap values out of 1,000 for the Touchon tree (shown if <1,000). Annotations in gray show the number of REALPHY single-reference trees that support the particular branch points (only shown if <21 for E. coli and <3 for P. syringae). Boxed parts of the trees contain differences to the previously published corresponding tree. (A) E. coli phylogeny reconstructed by Touchon et al. (2009) (left) compared with a phylogeny reconstructed from all 21 merged reference alignments produced by REALPHY. The differences between the two trees are the placements of E. coli 536 and S88. (B) P. syringae phylogeny reconstructed by Baltrus et al. (2011) (left) compared with a phylogeny based on mappings to the three fully sequenced P. syringae strains: P. syringae B728a, P. syringae pv. phaseolicola 1448a and P. syringae pv. tomato DC3000. Right: The root of the tree was arbitrarily selected to facilitate comparison between the two topologies. When inferring trees from single reference genome alignments, two branch points are not supported by all three trees (annotated on the corresponding branches). These branch points concern the placement of Cit7 (P. syringae B728a as reference) and Pae (P. syringae pv. phaseolicola 1448a as reference).
F<sc>ig</sc>. 7.
Fig. 7.
Comparison between two phylogenies inferred from a REALPHY alignment of Sinorhizobium meliloti strains (Epstein et al. 2012) including (left) and excluding (right) nonpolymorphic alignment sites. The alignments were created by merging the reference alignments from S. meliloti Rm41 and 1021. The red box highlights differing branch points. Bootstrap support is indicated if below 100%, except for the blue clade where the support is low.
F<sc>ig</sc>. 8.
Fig. 8.
Illustration of the individual steps in the REALPHY pipeline (running from top to bottom). All fully sequenced or assembled genomes (FASTA and GenBank files) are divided into all overlapping 50-bp subsequences. Short sequences are aligned to individual reference sequences with Bowtie2. Alignment columns are created from all pairwise mappings to the references. Individual reference alignments are merged into a single multiple sequence alignment. A phylogeny is reconstructed from merged and individual reference alignments via PhyML.

References

    1. Baltrus DA, Nishimura MT, Romanchuk A, Chang JH, Mukhtar MS, Cherkis K, Roach J, Grant SR, Jones CD, Dangl JL. Dynamic evolution of pathogenicity revealed by sequencing and comparative genomics of 19 Pseudomonas syringae isolates. PLoS Pathog. 2011;7(7):e1002132. - PMC - PubMed
    1. Chenna R, Sugawara H, Koike T, Lopez R, Gibson TJ, Higgins DG, Thompson JD. Multiple sequence alignment with the Clustal series of programs. Nucleic Acids Res. 2003;31(13):3497–3500. - PMC - PubMed
    1. Chun J, Grim CJ, Hasan NA, Lee JH, Choi SY, Haley BJ, Taviani E, Jeon YS, Kim DW, Lee JH, et al. Comparative genomics reveals mechanism for short-term and long-term clonal transitions in pandemic Vibrio cholerae. Proc Natl Acad Sci U S A. 2009;106(36):15442–15447. - PMC - PubMed
    1. Croucher NJ, Harris SR, Fraser C, Quail MA, Burton J, van der Linden M, McGee L, von Gottberg A, Song JH, Ko KS, et al. Rapid pneumococcal evolution in response to clinical interventions. Science. 2011;331(6016):430–434. - PMC - PubMed
    1. Cui Y, Yu C, Yan Y, Li D, Li Y, Jombart T, Weinert LA, Wang Z, Guo Z, Xu L, et al. Historical variations in mutation rate in an epidemic pathogen. Yersinia pestis. Proc Natl Acad Sci U S A. 2013;110(2):577–582. - PMC - PubMed

Publication types

LinkOut - more resources