. 2014 Feb 21:8:26.
doi: 10.3389/fnsys.2014.00026. eCollection 2014.

Cochlear neuropathy and the coding of supra-threshold sound

Affiliations

Cochlear neuropathy and the coding of supra-threshold sound

Hari M Bharadwaj et al. Front Syst Neurosci. .

Abstract

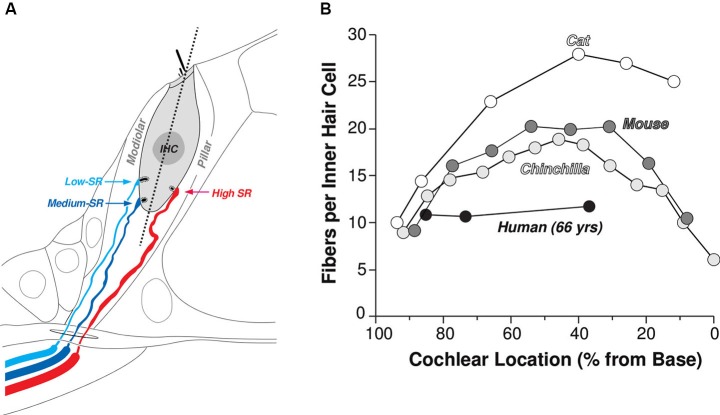
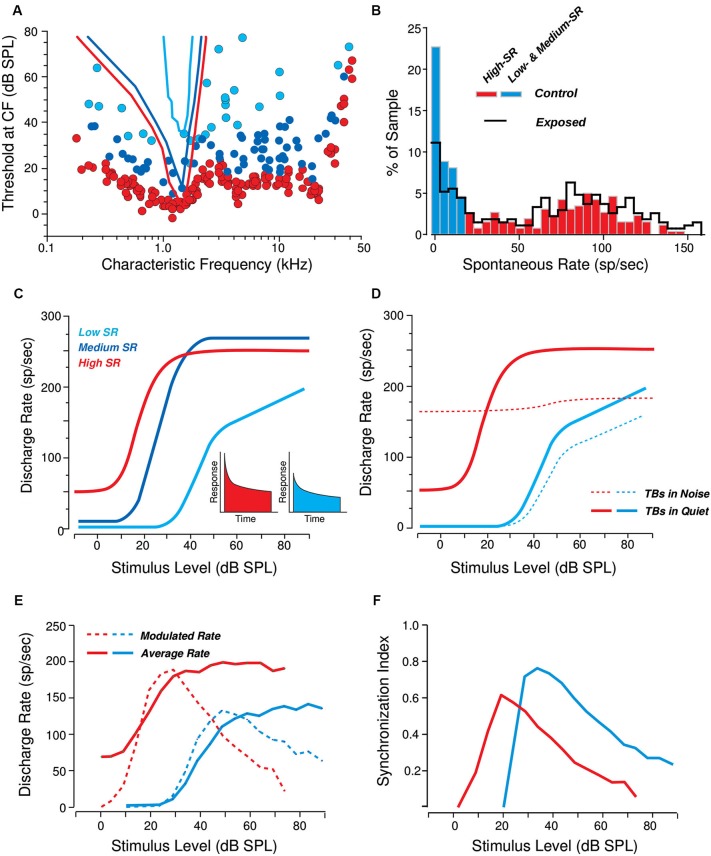
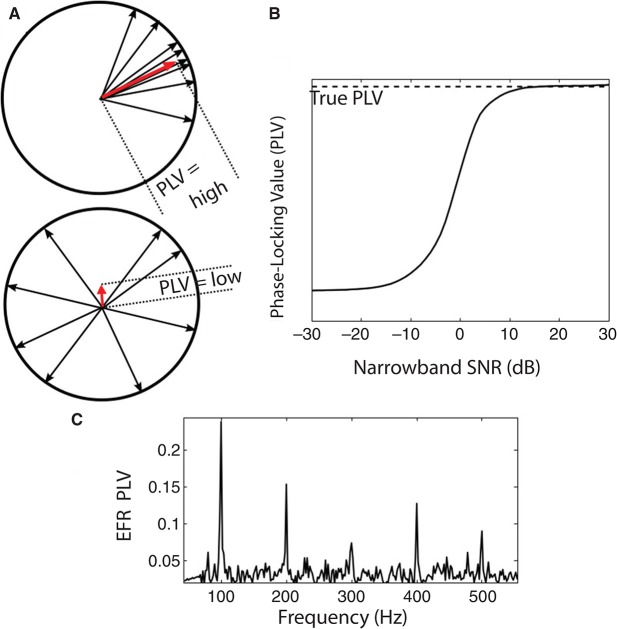
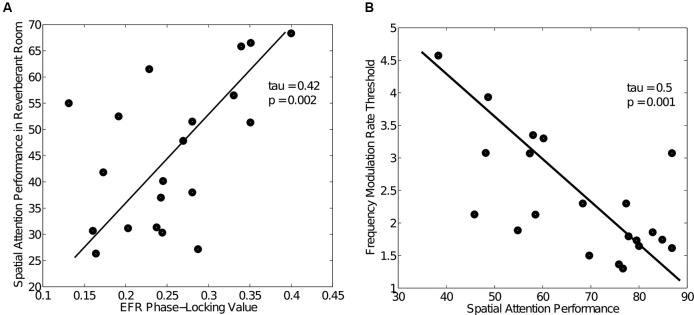
Many listeners with hearing thresholds within the clinically normal range nonetheless complain of difficulty hearing in everyday settings and understanding speech in noise. Converging evidence from human and animal studies points to one potential source of such difficulties: differences in the fidelity with which supra-threshold sound is encoded in the early portions of the auditory pathway. Measures of auditory subcortical steady-state responses (SSSRs) in humans and animals support the idea that the temporal precision of the early auditory representation can be poor even when hearing thresholds are normal. In humans with normal hearing thresholds (NHTs), paradigms that require listeners to make use of the detailed spectro-temporal structure of supra-threshold sound, such as selective attention and discrimination of frequency modulation (FM), reveal individual differences that correlate with subcortical temporal coding precision. Animal studies show that noise exposure and aging can cause a loss of a large percentage of auditory nerve fibers (ANFs) without any significant change in measured audiograms. Here, we argue that cochlear neuropathy may reduce encoding precision of supra-threshold sound, and that this manifests both behaviorally and in SSSRs in humans. Furthermore, recent studies suggest that noise-induced neuropathy may be selective for higher-threshold, lower-spontaneous-rate nerve fibers. Based on our hypothesis, we suggest some approaches that may yield particularly sensitive, objective measures of supra-threshold coding deficits that arise due to neuropathy. Finally, we comment on the potential clinical significance of these ideas and identify areas for future investigation.

Keywords: aging; auditory nerve; auditory steady-state response; frequency-following response; individual differences; noise-induced hearing loss; temporal coding; temporary threshold shift.


Figures

Figure 1
Figure 1
Innervation of the IHCs by terminals of the cochlear nerve. (A) Schematic illustrating the spatial separation of the synaptic contacts of high- (SR > about 18 spikes/s) vs. medium- and low-SR fibers on the pillar vs. modiolar sides of the IHCs, respectively. (B) Counts of cochlear nerve terminals per IHCs as a function of cochlear location from four mammalian species: cat (Liberman et al., 1990), mouse (Maison et al., 2013), chinchilla (Bohne et al., 1982) and human (Nadol, 1983).
Figure 2
Figure 2
Response differences among cochlear nerve fibers of the three SR groups. (A) Threshold tuning curves of example high- medium- and low-SR fibers (see key in C) are superimposed on a scatterplot of thresholds at the characteristic frequency (CF) for all the fibers sampled from one animal. Data from cat (Liberman, 1978). (B) Distribution of spontaneous rates in large samples of cochlear nerve fibers before (red and blue bars) vs. after (black line) a noise exposure causing a reversible elevation of thresholds. Data from guinea pig (Furman et al., 2013). (C, D) Schematic rate-vs-level functions for high-, medium-, and low-SR fibers to tone bursts (TBs) at the CF, in quiet (C) and in continuous background noise at a fixed 0 dB spectrum level (D). Data from cat (Liberman, ; Costalupes et al., 1984). The insets in panel C show schematic peri-stimulus time histograms of the response to a moderate-level tone burst: onset rates are higher in the high-SR fiber than in the low-SR fiber. (E, F) Responses to SAM tones in high- vs. low-SR fibers expressed as average rate and modulated rate (E) or average synchrony (F; see text for definitions). Responses are to carrier tones at the CF, amplitude modulated (AM) at 100 Hz. Data from cat (Joris and Yin, 1992).
Figure 3
Figure 3
(A) An illustration of the PLV metric computation. The SSSR from each trial is represented by a vector (phasor, shown as a black arrow) with unit magnitude and with phase equal to the EFR phase at the frequency bin of analysis. The vector average of these phasors is computed; the magnitude of the resultant vector (shown as red arrow) yields the PLV. The top panel is an example with high PLV: the phase of the responses varies over a narrow range across trials. The bottom panel is an example with low PLV: response phase relative to stimulus onset is essentially random over the unit circle. (B) Relationship between the single-trial SNR of the measurement in the frequency bin of interest and the estimated PLV for a simulated signal in additive noise. At sufficiently high SNR values, the estimated PLV converges to the true PLV (aside from a small sample bias that depends on the number of trials). At lower SNRs, the estimate is biased to be lower than the true value. This is an important consideration when comparing PLVs across sound levels or individuals, since the SNR depends on the magnitude of the true underlying response, the geometry of the generators, and the volume conductor in between. (C) Sample PLV spectrum obtained in response to a 100 Hz transposed tone at a carrier frequency of 4 kHz at 65 dB SPL (RMS). Strong peaks are evident in the PLV at multiples of the envelope frequency.
Figure 4
Figure 4
Human behavioral and EFR data (data from Ruggles et al., 2011, 2012) showing large variability in both performance and temporal coding fidelity among NHT participants. (A) Relationship between spatial attention task performance in reverberation and EFR PLV across NHT listeners. Task performance varied from chance levels (30%) to about 70% with a concomitant variation in EFR phase locking. Listeners with good temporal coding of envelopes as measured by the EFR PLV were able to spatially segregate the competing speech streams and performed well. (B) Relationship between spatial attention task performance and frequency modulation (FM) detection thresholds (data from Ruggles et al., 2011), a task known to rely on robust encoding of TFS.
Figure 5
Figure 5
(A) A parsimonious model of the population response of IC cells to envelope fluctuations. The model comprised of ANFs (simulated using the Zilany et al., model) driving the cochlear nucleus (CN), which in turn drives the IC. CN and IC processing of envelope were simulated using the Nelson and Carney (2004) model. A tonotopic array of 50 CFs was used. High- and lower-SR ANFs were simulated at each CF and the corresponding IC responses were combined with weigths equal to the proportion of each group in the population (60% High- and 40% Lower-SR, Liberman, 1978). Neuropathy was simulated by reducing the weight given to the lower-SR driven response. (B) Level curves for the population response with different levels of neuropathy for a 100 Hz SAM tone at 4 kHz, with a 60% modulation depth and added broadband noise with a notch centered around 4 kHz and 800 Hz wide on each side. The SNR was fixed at 20 dB (broadband RMS) at all levels. The differences between the levels of neuropathy are most accentuated in the population response at higher stimulus levels. This also suggests that slopes of the level curve at high levels may reflect the level of neuropathy. (C) Population response as a function of modulation depth for different levels of neuropathy for an 80 dB SPL SAM tone in notched noise (SNR = 20 dB broadband RMS). The differences between the levels of neuropathy are more evident for smaller modulation depths. In addition, this suggests that the slope of the population response strength as a function of modulation depth may be sensitive to the level of neuropathy.

Similar articles

Cited by

References

    1. Aiken S. J., Picton T. W. (2008). Envelope and spectral frequency-following responses to vowel sounds. Hear. Res. 245, 35–47 10.1016/j.heares.2008.08.004 - DOI - PubMed
    1. Alain C., Arnott S. R. (2000). Selectively attending to auditory objects. Front. Biosci. 5, D202–D212 10.2741/alain - DOI - PubMed
    1. Arnold S., Burkard R. (2002). Inner hair cell loss and steady-state potentials from the inferior colliculus and auditory cortex of the chinchilla. J. Acoust. Soc. Am. 112, 590–599 10.1121/1.1494991 - DOI - PubMed
    1. Bernstein L. R., Trahiotis C. (2002). Enhancing sensitivity to interaural delays at high frequencies by using “transposed stimuli”. J. Acoust. Soc. Am. 112, 1026–1036 10.1121/1.1497620 - DOI - PubMed
    1. Bharadwaj H. M., Masud M., Shinn-Cunningham B. G. (2013). Bottom-up and top-down contributions to individual differences in auditory spatial attention task performance. Presented at the Abstracts of the Midwinter Meeting of the ARO XXXVI: #887.