. 2014 Feb 21:8:14.
doi: 10.3389/fninf.2014.00014. eCollection 2014.

Machine learning for neuroimaging with scikit-learn

Affiliations

Machine learning for neuroimaging with scikit-learn

Alexandre Abraham et al. Front Neuroinform. .

Abstract

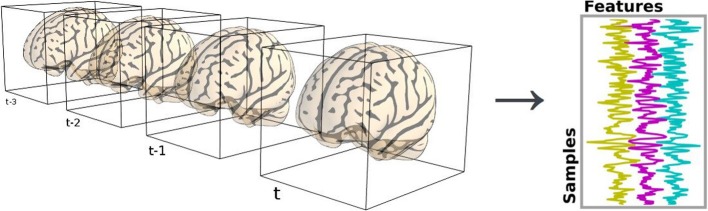
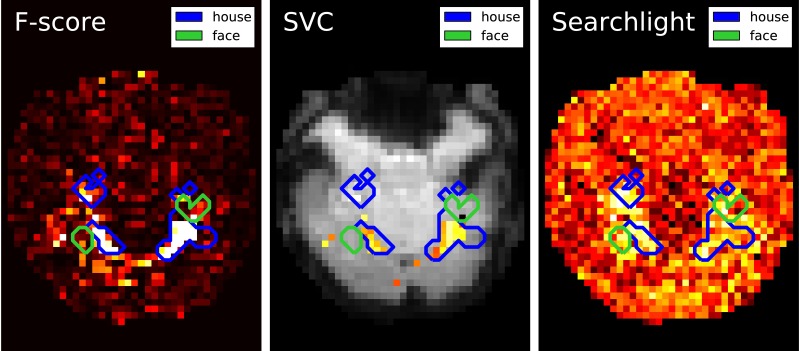
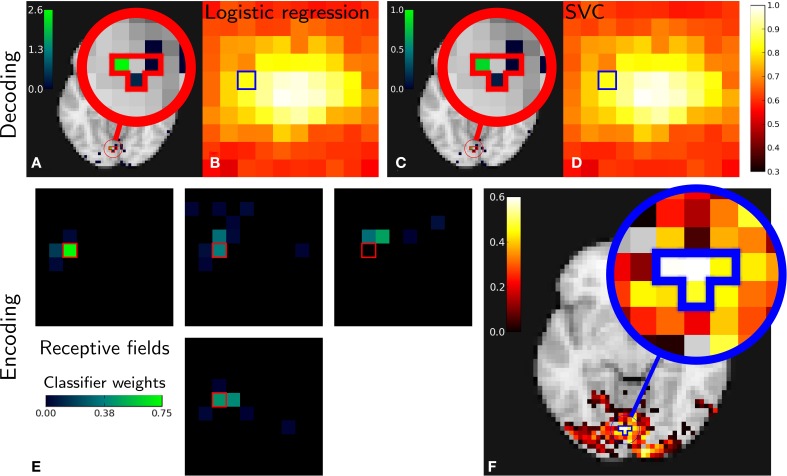
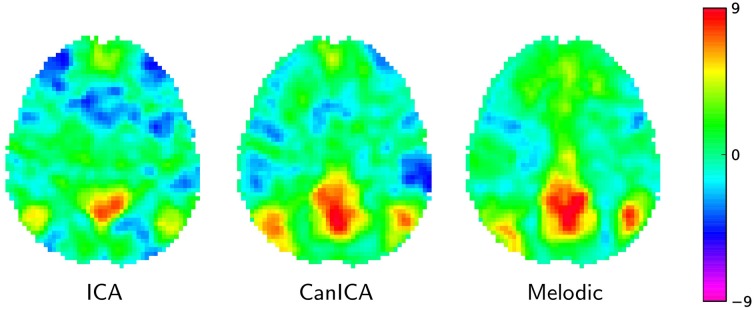
Statistical machine learning methods are increasingly used for neuroimaging data analysis. Their main virtue is their ability to model high-dimensional datasets, e.g., multivariate analysis of activation images or resting-state time series. Supervised learning is typically used in decoding or encoding settings to relate brain images to behavioral or clinical observations, while unsupervised learning can uncover hidden structures in sets of images (e.g., resting state functional MRI) or find sub-populations in large cohorts. By considering different functional neuroimaging applications, we illustrate how scikit-learn, a Python machine learning library, can be used to perform some key analysis steps. Scikit-learn contains a very large set of statistical learning algorithms, both supervised and unsupervised, and its application to neuroimaging data provides a versatile tool to study the brain.

Keywords: Python; machine learning; neuroimaging; scikit-learn; statistical learning.


Figures

Figure 1
Figure 1
Conversion of brain scans into 2-dimensional data.
Figure 2
Figure 2
Maps derived by different methods for face versus house recognition in the Haxby experiment—left: standard analysis; center: SVM weights after screening voxels with an ANOVA; right: Searchlight map. The masks derived from standard analysis in the original paper (Haxby et al., 2001) are displayed in blue and green.
Figure 3
Figure 3
Miyawaki results in both decoding and encoding. Relations between one pixel and four brain voxels is highlighted for both methods. Top: Decoding. Classifier weights for the pixel highlighted [(A) Logistic regression, (C) SVM]. Reconstruction accuracy per pixel [(B) Logistic regression, (D) SVM]. Bottom: Encoding. (E): receptive fields corresponding to voxels with highest scores and its neighbors. (F): reconstruction accuracy depending on pixel position in the stimulus—note that the pixels and voxels highlighted are the same in both decoding and encoding figures and that encoding and decoding roughly match as both approach highlight a relationship between the same pixel and voxels.
Figure 4
Figure 4
Default mode network extracted using different approaches: left: the simple Concat-ICA approach detailed in this article; middle: CanICA, as implemented in nilearn; right: Melodic's concat-ICA. Data have been normalized (set to unit variance) for display purposes.
Figure 5
Figure 5
Brain parcellations extracted by clustering. Colors are random. (A) K-means, 100 clusters, (B) Ward, 100 clusters, (C) K-means, 1000 clusters, and (D) Ward, 1000 clusters.

References

    1. Beckmann C. F., Smith S. M. (2004). Probabilistic independent component analysis for functional magnetic resonance imaging. Trans. Med. Imaging 23, 137–152 10.1109/TMI.2003.822821 - DOI - PubMed
    1. Biswal B., Zerrin Yetkin F., Haughton V., Hyde J. (1995). Functional connectivity in the motor cortex of resting human brain using echo-planar MRI. Magn. Reson. Med. 34, 53719 10.1002/mrm.1910340409 - DOI - PubMed
    1. Calhoun V. D., Adali T., Pearlson G. D., Pekar J. J. (2001). A method for making group inferences from fMRI data using independent component analysis. Hum. Brain Mapp. 14, 140 10.1002/hbm.1048 - DOI - PMC - PubMed
    1. Craddock R., James G., Holtzheimer P., III, Hu X., Mayberg H. (2011). A whole brain fmri atlas generated via spatially constrained spectral clustering. Hum. Brain Mapp. 33, 1914–1928 10.1002/hbm.21333 - DOI - PMC - PubMed
    1. Detre G., Polyn S., Moore C., Natu V., Singer B., Cohen J., et al. (2006). The multi-voxel pattern analysis (mvpa) toolbox, in Poster Presented at the Annual Meeting of the Organization for Human Brain Mapping (Florence, Italy: ). Available online at: http://www.csbmb.princeton.edu/mvpa