. 2014 Feb 21:5:69.
doi: 10.3389/fphys.2014.00069. eCollection 2014.

Muscle hypertrophy is associated with increases in proteasome activity that is independent of MuRF1 and MAFbx expression

Affiliations

Muscle hypertrophy is associated with increases in proteasome activity that is independent of MuRF1 and MAFbx expression

Leslie M Baehr et al. Front Physiol. .

Abstract

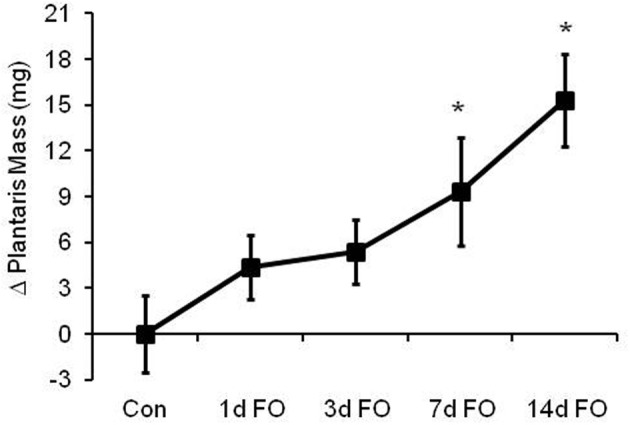
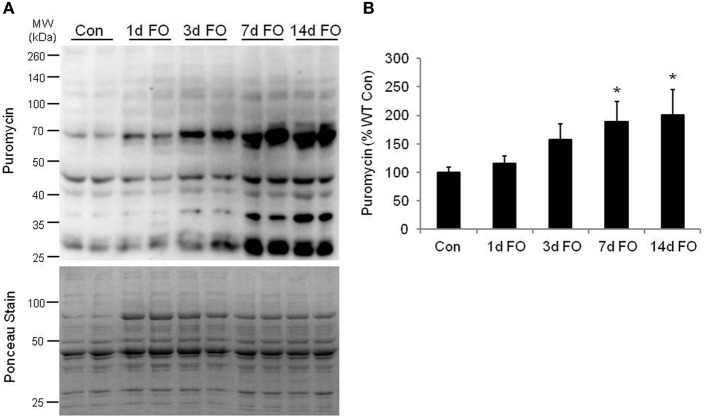
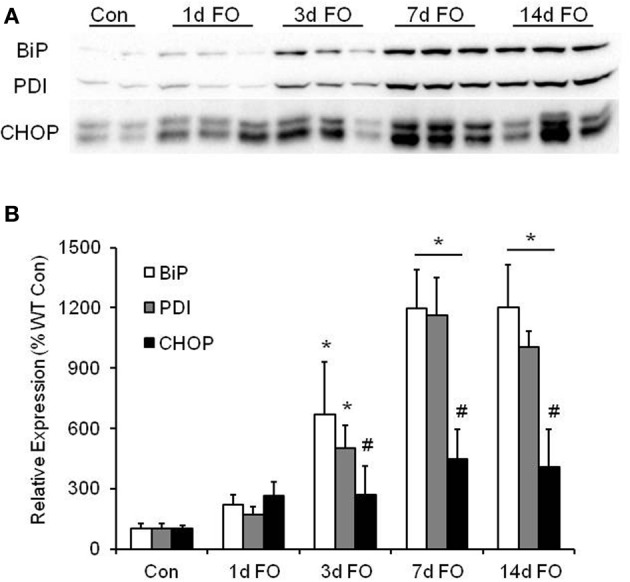
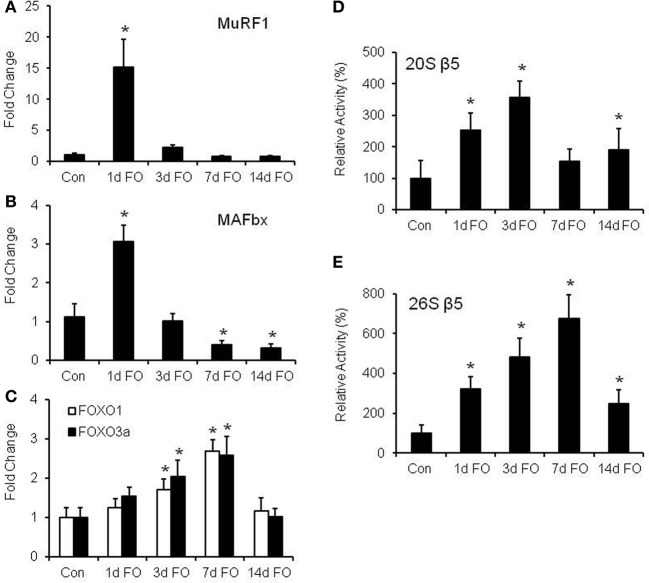
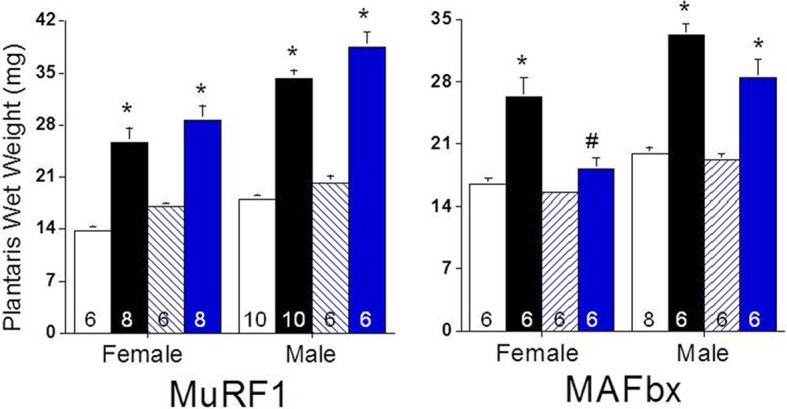
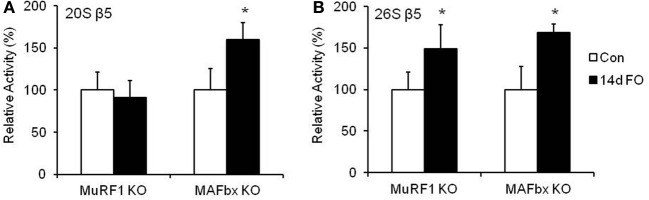
The regulation of skeletal muscle mass depends on the balance between protein synthesis and degradation. The role of protein degradation and in particular, the ubiquitin proteasome system, and increased expression of the E3 ubiquitin ligases, MuRF1 and MAFbx/atrogin-1, in the regulation of muscle size in response to growth stimuli is unclear. Thus, the aim of this study was to measure both proteasome activity and protein synthesis in mice over a 14-day period of chronic loading using the functional overload (FO) model. Further, the importance of MuRF1 and MAFbx expression in regulating muscle hypertrophy was examined by measuring muscle growth in response to FO in mice with a null deletion (KO) of either MuRF1 or MAFbx. In wild type (WT) mice, the increase in muscle mass correlated with significant increases (2-fold) in protein synthesis at 7 and 14 days. Interestingly, proteasome activity significantly increased in WT mice after one day, and continued to increase, peaking at 7 days following FO. The increase in proteasome activity was correlated with increases in the expression of the Forkhead transcription factors, FOXO1 and FOXO3a, which increased after both MuRF1 and MAFbx increased and returned to baseline. As in WT mice, hypertrophy in the MuRF1 and MAFbx KO mice was associated with significant increases in proteasome activity after 14 days of FO. The increase in plantaris mass was similar between the WT and MuRF1 KO mice following FO, however, muscle growth was significantly reduced in female MAFbx KO mice. Collectively, these results indicate that muscle hypertrophy is associated with increases in both protein synthesis and degradation. Further, MuRF1 or MAFbx expression is not required to increase proteasome activity following increased loading, however, MAFbx expression may be required for proper growth/remodeling of muscle in response to increase loading.

Keywords: forkhead transcription factors; functional overload; protein degradation; puromycin; ubiquitin proteasome system.


Figures

Figure 1
Figure 1
Time course of load-induced growth in wild type (WT) mice following functional overload (FO). Growth of the plantaris muscle was calculated after 1, 3, 7, and 14 days of FO and expressed as a change in mass relative to the control group. Data are expressed as mean ± SD (n = 8/group). *P < 0.05 vs. control.
Figure 2
Figure 2
Measurement of protein synthesis using the SUnSET method following functional overload (FO). (A) Representative image of western blot analysis for puromycin following no treatment (Con) and FO for 1, 3, 7, or 14 days in WT mice. The corresponding ponceau stain was used to verify equal loading of proteins. (B) Quantification of the puromycin western blots. Puromycin values are expressed as a percentage of the control muscles value (mean ± SD, n = 5/group). *P < 0.05 vs. control puromycin expression.
Figure 3
Figure 3
Markers of endoplasmic reticulum (ER) stress are higher in the plantaris muscle following functional overload (FO). (A) Representative western blot of ER stress markers BiP, PDI, and CHOP in WT mice after no treatment (Con) and 1, 3, 7, and 14 days of FO. (B) Quantification of the western blots for BiP (open bars), PDI (gray bars), and CHOP (black bars). A ponceau stain of the membrane was used to normalize protein expression. Data are expressed as a percentage of the respective control value for each protein (mean ± SD, n = 4–6/group). *P < 0.05 vs. control expression for each protein, #P < 0.05 CHOP vs. BiP, or PDI at given time point.
Figure 4
Figure 4
Functional overload (FO) induces a proteolytic response in the plantaris muscle. mRNA expression of (A) MuRF1, (B) MAFbx, and (C) FOXO1, and FOXO3a was measured in WT mice following no treatment (Con) and FO for 1, 3, 7, or 14 days. Expression values were normalized to GAPDH and are expressed as a fold change (mean ± SD) relative to control (n = 7/group) *P < 0.05 vs. control mRNA expression. Activity of the β5 subunit of the 20S (D) and 26S (E) proteasome was assessed by fluorometric assay in WT mice following no treatment (Con) and FO for 1, 3, 7, or 14 days. Data is expressed as a percentage of the control value (mean ± SD, n = 5–8/group). *P < 0.05 vs. control proteolytic activity.
Figure 5
Figure 5
Response of MuRF1 and MAFbx KO mice to functional overload (FO). Growth of the plantaris muscle was calculated after 14 days of FO in male and female WT, MuRF1 KO, and MAFbx KO mice and expressed as absolute wet weight (mg). Measurements were made in untreated control [white (WT) or blue hatched (KO) bars] and overloaded [black (WT) and blue (KO) bars] muscles. Data are expressed as mean ± s.e.m and group size is indicated in each bar. *P < 0.05 vs. control; #P < 0.05 vs. WT FO.
Figure 6
Figure 6
Proteasome activity increases in MuRF1 and MAFbx null (KO) mice after 14 days of functional overload (FO). Proteolytic activity of the β5 subunit of the 20S (A) and 26S (B) proteasome was assessed by fluorometric assay in MuRF1 and MAFbx KO mice after no treatment (Con, open bars) or 14 days of functional overload (14d FO, black bars). Data are expressed as a percentage of each respective control value (mean ± SD, n = 4–6/group). *P < 0.05 vs. control.

References

    1. Adams V., Mangner N., Gasch A., Krohne C., Gielen S., Hirner S., et al. (2008). Induction of MuRF1 is essential for TNF-alpha-induced loss of muscle function in mice. J. Mol. Biol. 384, 48–59 10.1016/j.jmb.2008.08.087 - DOI - PubMed
    1. Auclair D., Garrel D. R., Chaouki Zerouala A., Ferland L. H. (1997). Activation of the ubiquitin pathway in rat skeletal muscle by catabolic doses of glucocorticoids. Am. J. Physiol. 272, C1007–C1016 - PubMed
    1. Baar K., Nader G., Bodine S. (2006). Resistance exercise, muscle loading/unloading and the control of muscle mass. Essays Biochem. 42, 61–74 10.1042/bse0420061 - DOI - PubMed
    1. Baehr L. M., Furlow J. D., Bodine S. C. (2011). Muscle sparing in muscle RING finger 1 null mice: response to synthetic glucocorticoids. J. Physiol. 589, 4759–4776 10.1113/jphysiol.2011.212845 - DOI - PMC - PubMed
    1. Bodine S. C., Latres E., Baumhueter S., Lai V. K.-M., Nunez L., Clarke B. A., et al. (2001a). Identification of ubiquitin ligases required for skeletal muscle atrophy. Science 294, 1704–1708 10.1126/science.1065874 - DOI - PubMed

LinkOut - more resources