. 2013 Mar 28:3:110.
doi: 10.4172/2161-0460.1000110.

Time-Dependent Compensatory Responses to Chronic Neuroinflammation in Hippocampus and Brainstem: The Potential Role of Glutamate Neurotransmission

Affiliations

Time-Dependent Compensatory Responses to Chronic Neuroinflammation in Hippocampus and Brainstem: The Potential Role of Glutamate Neurotransmission

Holly M Brothers et al. J Alzheimers Dis Parkinsonism. .

Abstract

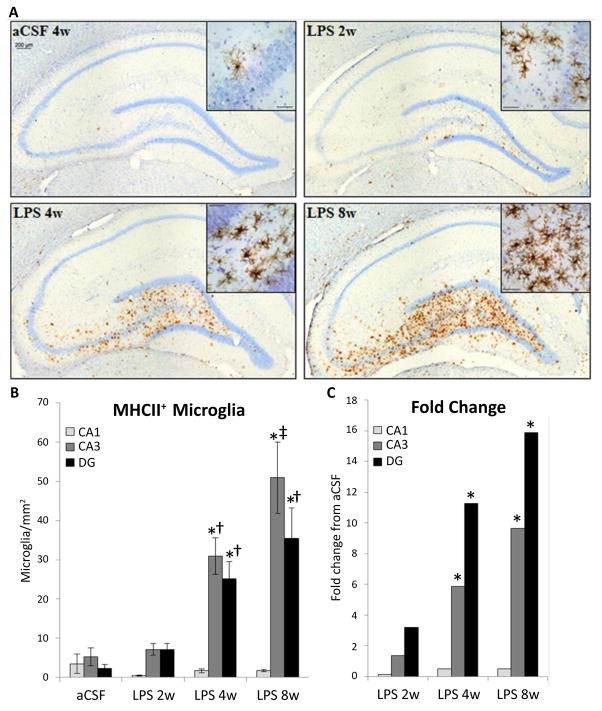
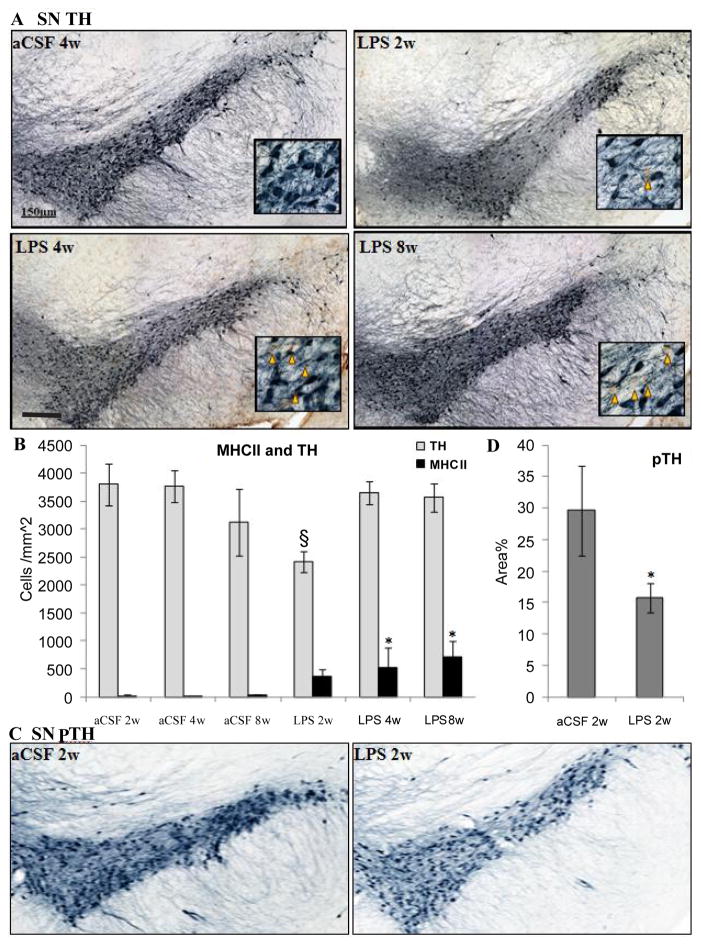
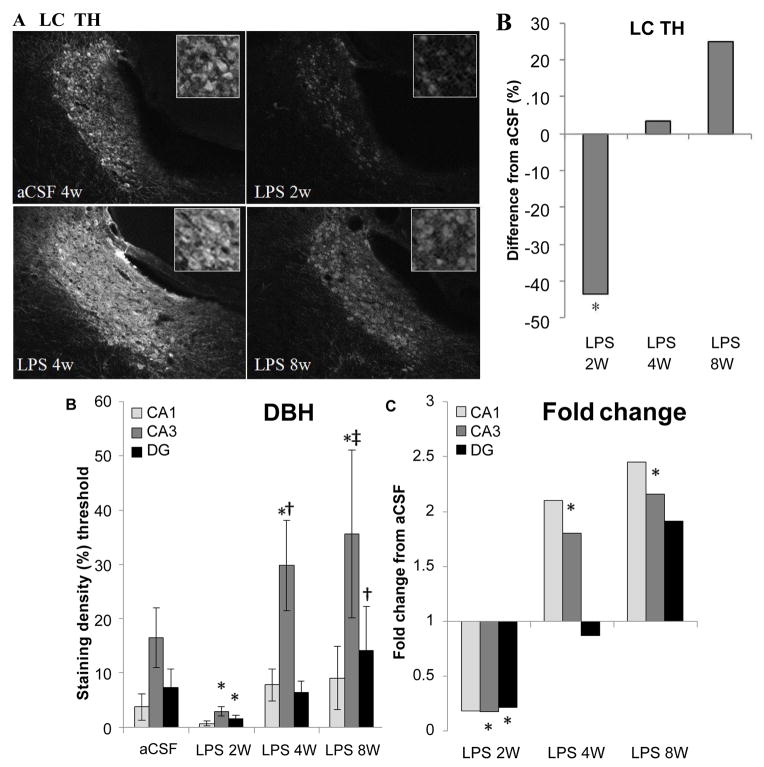
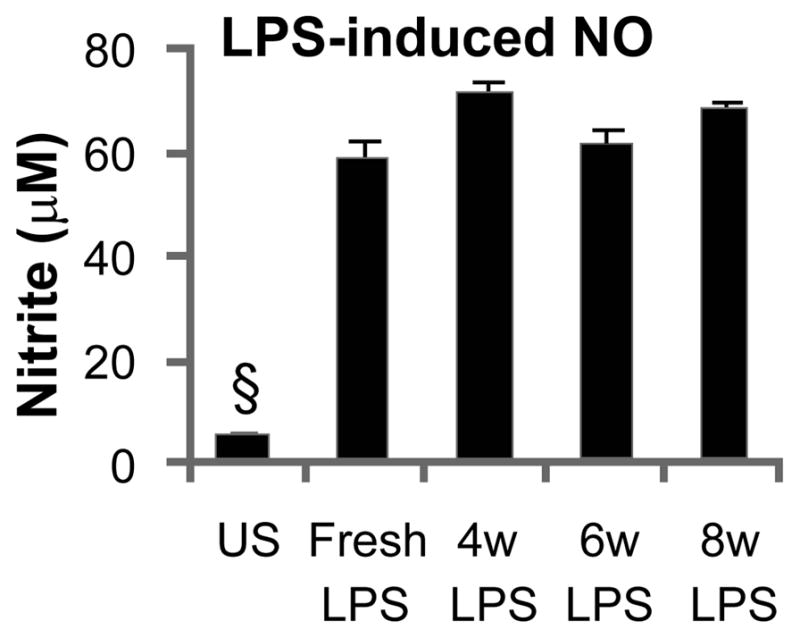
Chronic neuroinflammation is characteristic of neurodegenerative diseases and is present during very early stages, yet significant pathology and behavioral deficits do not manifest until advanced age. We investigated the consequences of experimentally-induced chronic neuroinflammation within the hippocampus and brainstem of young (4 mo) F-344 rats. Lipopolysaccharide (LPS) was infused continuously into the IVth ventricle for 2, 4 or 8 weeks. The number of MHC II immunoreactive microglia in the brain continued to increase throughout the infusion period. In contrast, performance in the Morris water maze was impaired after 4 weeks but recovered by 8 weeks. Likewise, a transient loss of tyrosine hydroxylase immunoreactivity in the substantia nigra and locus coeruleus was observed after 2 weeks, but returned to control levels by 4 weeks of continuous LPS infusion. These data suggest that direct activation of microglia is sufficient to drive, but not sustain, spatial memory impairment and a decrease in tyrosine hydroxylase production in young rats. Our previous studies suggest that chronic neuroinflammation elevates extracellular glutamate and that this elevation underlies the spatial memory impairment. In the current study, increased levels of GLT1 and SNAP25 in the hippocampus corresponded with the resolution of performance deficit. Increased expression of SNAP25 is consistent with reduced glutamate release from axonal terminals while increased GLT1 is consistent with enhanced clearance of extracellular glutamate. These data demonstrate the capacity of the brain to compensate for the presence of chronic neuroinflammation, despite continued activation of microglia, through changes in the regulation of the glutamatergic system.

Keywords: Alzheimer; Excitatory amino acid transporter; Glutamate; Lipopolysaccharide; Neuroinflammation; Parkinson; Rat; SNAP25.


Figures

Figure 1
Figure 1
Morris water maze performance. Rats infused with LPS for 4 weeks have increased latency to find the hidden platform (A) compared to aCSF 4w on days 3 and 4 (p<0.001*) and LPS 8w on testing days 2 through 4 (p ≤ 0.041). LPS 4w spent a greater percentage of time in the perimeter of the pool (B) than both aCSF 4w and LPS 8w (p ≤ 0.008*†) on days 3 and 4. LPS 4w did not swim slower (C) than aCSF controls, however, LPS 8w swam faster than LPS 4w on day 1) and aCSF 8w on day 2 (p<0.05*†). LPS 4w spent less time within the radius of the absent platform (D) than did aCSF 4w (p=0.012*) and LPS 8w (p=0.016).
Figure 2
Figure 2
Distribution of MHC II-IR microglia (brown cells) within the hippocampus counterstained with cresyl violet (A) at 10X and 20X (insert). Scale bar = 200 μm. Number of MHC II-IR cells was counted per area (B). LPS infusion lead to an increased in the density of MHC II-IR microglia in hippocampal subregion; CA3>CA1 of LPS 2w (p=0.041) and CA3>DG>CA1 in LPS 4w and LPS 8w (p≤0.022). Within the DG and CA3, LPS 4w and LPS 8w had significantly more MHC II-IR microglia than aCSF controls and LPS 2w (p≤0.001*†). In the CA3, LPS 8w rats had significantly more MHC II-IR microglia than LPS 4w rats (p=0.029).
Figure 3
Figure 3
GLT1-IR within the CA3 of the hippocampus. Shown at 10 X (A), staining density was evaluated (B) and expressed in LPS-infused rats relative to controls (C). Scale bar=200 μm. The density of GLT1 showed a significant main effect of experimental group (p<0.001) and region (p<0.05), i.e. more GLT1 staining was observed in LPS 8w than aCSF controls (*p<0.01).
Figure 4
Figure 4
SNAP25-IR within the hippocampus. Shown at 10X (A), staining density was evaluated (B) and expressed in LPS-infused rats relative to controls (C). Scale bar = 800 μm. There was a higher density of staining in LPS 8w than aCSF 8w (p<0.001*) and compared to LPS 2w and LPS 4w (p≤0.015†‡). For all groups CA3>DG>CA1 (p≤0.014), except aCSF 2w in which CA3 and DG are not significantly different. SNAP25-IR increased in the CA3 region of LPS 4w as compared to aCSF controls (p=0.004*). LPS 8w expressed more SNAP25 in all regions than aCSF 8w (p≤0.046*), in CA1 and CA3 compared to LPS 4w (p≤0.031) and compared to LPS 2w in CA1
Figure 5
Figure 5
Distribution of TH-IR neurons (blue) and MHC II-IR microglia (brown). (A) The SNpc (A) at 10 X with inset at 40 X (orange triangles mark the site of MHC II-IR microglia). Scale bar=150 μm. Quantification of TH in the SNpc (B) demonstrates that there is a reduction in the number of TH-IR neurons after chronic LPS infusion for 2 weeks compared to aCSF controls (p=0.025§)., but not after 4 or 8 weeks LPS infusion. MHCII-IR microglia number is increased after 4 and 8 weeks LPS infusion compared to aCSF controls (p=0.031*). There is significantly less staining density of pTH in LPS 2w than aCSF 2w (C,D p<0.025).
Figure 6
Figure 6
Integrity of the LC projection to the hippocampus. Within the LC, there is a decrease in TH staining (A) after 2 weeks LPS infusion (p<0.001) that is resolved by 4 weeks (B). Compared to controls, DBH staining intensity was reduced in CA3 and DG of LPS 2w and elevated in CA3 of LPS 4w and LPS 8w (*p≤ 0.007, C). DBH staining is more dense in LPS 4w CA3 and LPS 8w DG (†p≤ 0.028) than LPS 2w in the corresponding regions. LPS 8w CA3 is more dense with DBH staining than both LPS 2w and LPS 4w (‡p≤ 0.009, D).
Figure 7
Figure 7
LPS maintains potency after incubation in osmotic minipump. Cultured BV-2 microglia cells responded to fresh LPS as well as LPS that had been incubated in an Alzet osmotic minipump for 4, 6 or 8 weeks (at 37° C in 0.9% saline bath) with the release of similarly increased levels of NO, as compared to un-stimulated cells (§p<0.003).

References

    1. Akiyama H, Barger S, Barnum S, Bradt B, Bauer J, et al. Inflammation and Alzheimer’s disease. Neurobiol Aging. 2000;21:383–421. - PMC - PubMed
    1. Hirsch EC, Breidert T, Rousselet E, Hunot S, Hartmann A, et al. The role of glial reaction and inflammation in Parkinson’s disease. Ann N Y Acad Sci. 2003;991:214–228. - PubMed
    1. Glass CK, Saijo K, Winner B, Marchetto MC, Gage FH. Mechanisms underlying inflammation in neurodegeneration. Cell. 2010;140:918–934. - PMC - PubMed
    1. Wahner AD, Sinsheimer JS, Bronstein JM, Ritz B. Inflammatory cytokine gene polymorphisms and increased risk of Parkinson disease. Arch Neurol. 2007;64:836–840. - PubMed
    1. Reed-Geaghan EG, Savage JC, Hise AG, Landreth GE. CD14 and toll-like receptors 2 and 4 are required for fibrillar A{beta}-stimulated microglial activation. J Neurosci. 2009;29:11982–11992. - PMC - PubMed

LinkOut - more resources