Comparative Study
. 2014 May;155(5):2009-19.
doi: 10.1210/en.2013-2154. Epub 2014 Mar 6.

Inflammation-inducible type 2 deiodinase expression in the leptomeninges, choroid plexus, and at brain blood vessels in male rodents

Affiliations
Comparative Study

Inflammation-inducible type 2 deiodinase expression in the leptomeninges, choroid plexus, and at brain blood vessels in male rodents

Gábor Wittmann et al. Endocrinology. 2014 May.

Abstract

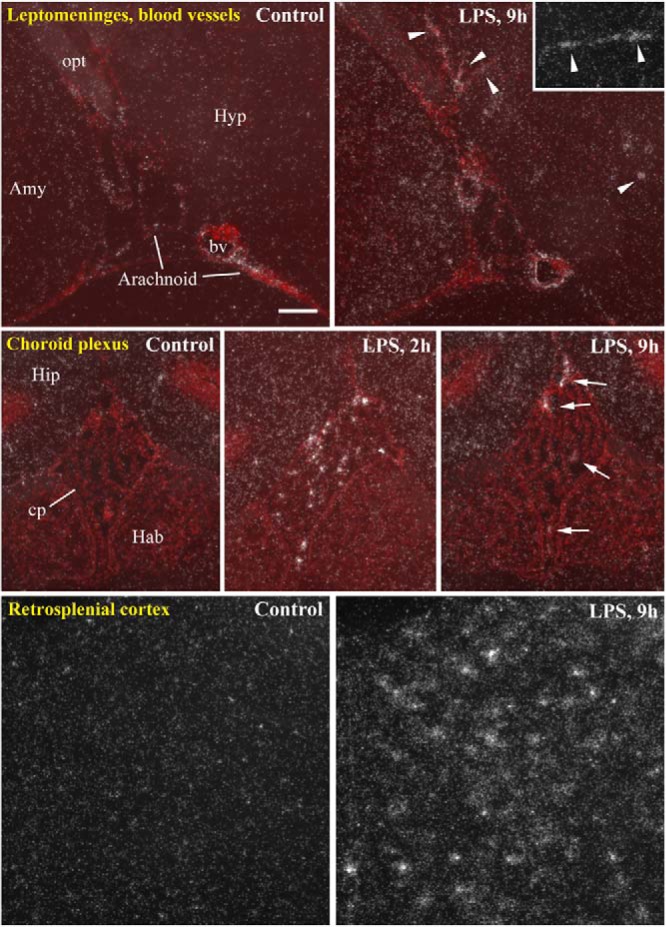
Thyroid hormone regulates immune functions and has antiinflammatory effects. In promoter assays, the thyroid hormone-activating enzyme, type 2 deiodinase (D2), is highly inducible by the inflammatory transcription factor nuclear factor-κ B (NF-κB), but it is unknown whether D2 is induced in a similar fashion in vivo during inflammation. We first reexamined the effect of bacterial lipopolysaccharide (LPS) on D2 expression and NF-κB activation in the rat and mouse brain using in situ hybridization. In rats, LPS induced very robust D2 expression in normally non-D2-expressing cells in the leptomeninges, adjacent brain blood vessels, and the choroid plexus. These cells were vimentin-positive fibroblasts and expressed the NF-κB activation marker, inhibitor κ B-α mRNA, at 2 hours after injection, before the increase in D2 mRNA. In mice, LPS induced intense D2 expression in the choroid plexus but not in leptomeninges, with an early expression peak at 2 hours. Moderate D2 expression along numerous brain blood vessels appeared later. D2 and NF-κB activation was induced in tanycytes in both species but with a different time course. Enzymatic assays from leptomeningeal and choroid plexus samples revealed exceptionally high D2 activity in LPS-treated rats and Syrian hamsters and moderate but significant increases in mice. These data demonstrate the cell type-specific, highly inducible nature of D2 expression by inflammation, and NF-κB as a possible initiating factor, but also warrant attention for species differences. The results suggest that D2-mediated T₃ production by fibroblasts regulate local inflammatory actions in the leptomeninges, choroid plexus and brain blood vessels, and perhaps also in other organs.


Figures

Figure 1.
Figure 1.
X-ray film autoradiograms of isotopic in situ hybridization demonstrate the effect of LPS on D2 mRNA expression in the rat brain. A, D2 mRNA expression in the function of time after LPS injection. Hybridization signal appears in the choroid plexus and parts of the leptomeninges at 4 hours, and is maximal by 9 hours. Using fresh frozen sections allowed for increased sensitivity to detect D2 mRNA, but the thin meningeal layers are less visible and not as intact as in perfused brains. B, Sections from paraformaldehyde-perfused brains with improved visibility of the leptomeninges demonstrate D2 mRNA expression throughout the entire leptomeningeal surface and choroid plexus 9 hours after LPS injection. lm, leptomeninges; cp, choroid plexus; tan, tanycytes. Scale bar, 2 mm.
Figure 2.
Figure 2.
Darkfield images of emulsion autoradiography illustrate the induction of D2 mRNA expression (silver grain accumulation, white) by LPS in rats. Red fluorescent cresyl-violet labeling is overlaid in the top and middle panels to help identify tissue locations. Top panel, LPS induces very intense D2 expression in the leptomeninges and nearby brain blood vessels (white arrowheads). Note that the bulk of D2-expressing cells are located in the loose arachnoid trabecular tissue and are almost absent from the arachnoid barrier layer. Middle panel, Induction of D2 mRNA by LPS in the lateral ventricle choroid plexus, leptomeningeal cells between the hippocampus and thalamus, and a nearby blood vessel (arrowhead). Bottom panel, Only a very modest increase can be observed in the parenchymal signal in the retrosplenial cortex corresponding to astrocyte D2 expression. Intense hybridization signal labels the leptomeningeal layer between the hemispheres and a blood vessel (arrowheads) 9 hours after LPS. Amy, amygdala; bv, blood vessel; cp, choroid plexus; fi, fimbria; Hip, hippocampus; Hyp, hypothalamus; lm, leptomeninges; opt, optic tract. Scale bar, 100 μm.
Figure 3.
Figure 3.
A, top panel, Combined fluorescent in situ hybridization and immunofluorescence demonstrates D2 mRNA (green) in vimentin-positive (red), fibroblast-type cells in the arachnoid trabecular tissue. Arrowheads point to double-labeled cells. Cell nuclei are labeled with DAPI (blue). In most cells, the hybridization signal concentrates as punctate densities in a subcompartment of the cell cytoplasm in contrast to vimentin, which labels the entire cytoplasm more evenly. Bottom panel, Triple fluorescent labeling for D2 mRNA, vimentin, and Iba1 demonstrate D2 mRNA in vimentin-positive cells along a brain blood vessel. Note the elongated shape of the cells and that D2 mRNA is transported into their processes. The Iba1-positive macrophage adjacent to a D2-expressing cell does not contain D2 mRNA. Scale bar, 20 μm. B, top panel left and middle, LPS induces IκBα mRNA in a large number of leptomeningeal cells at 2 hours after injection. Amy, amygdala; bv, blood vessel; Hyp, hypothalamus. Scale bar, 100 μm. Top panel right, Combined fluorescent in situ hybridization and immunofluorescence demonstrates IκBα mRNA (green) in vimentin-positive (red) cells at a brain blood vessel 2 hours after LPS. Note the elongated shape of the cells. Cell nuclei are labeled with DAPI (blue). Scale bar, 20 μm. Bottom panel, IκBα mRNA is expressed in numerous vimentin-positive cells in the arachnoid trabecular tissue 2 hours after LPS (arrowheads). Scale bar, 20 μm.
Figure 4.
Figure 4.
A, top panel, Darkfield images of emulsion autoradiography demonstrate markedly increased D2 mRNA expression (silver grain accumulation, white) in rat tanycytes at 4 hours after LPS and peak expression at 9 hours. Arrows point to D2 mRNA in the leptomeningeal layer under the median eminence. Bottom panel, Fluorescent in situ hybridization for IκBα mRNA shows no labeling in control rats and punctate labeling across the cell layer of β-tanycytes (arrows) 2 hours after LPS. Insets show the boxed areas at higher magnification. No signal is detected in β tanycytes at 4 hours. III, third ventricle; ME, median eminence. B, top panel, In mouse tanycytes, D2 mRNA levels peak 2 hours after LPS and then decline. Note that hybridization signal appears dorsally in some α-tanycytes (arrows) and is still present at 4 hours. Bottom panel, Intense IκBα mRNA expression (fluorescent in situ hybridization signal) is detected in mouse tanycytes 2 hours after LPS. The labeling decreases at 4 hours and vanishes by 9 hours. Note the overlap of IκBα expression with D2-expressing tanycytes. Scale bars, 200 μm on D2 and 50 μm on IκBα images.
Figure 5.
Figure 5.
A, X-ray film images of isotopic in situ hybridization demonstrate the effect of LPS on D2 mRNA expression in the mouse brain. Note the marked increase in parenchymal labeling starting at 2 hours and peaking at 9 hours. Scale bar, 1 mm. B, Number of D2 mRNA-expressing cells in the mouse choroid plexus and cerebral cortex as a function of time after LPS administration. Data represent the number of intensely labeled cells per section in the choroid plexus of the dorsal third ventricle and the number of silver grain clusters over 100 pixel size in a 2.8 mm2 area of the retrosplenial cortex. Significantly different from control: *, P < .01; **, P < .001.
Figure 6.
Figure 6.
Darkfield images of emulsion autoradiography illustrate the effect of LPS on D2 mRNA (silver grain accumulation, white) in mice. Red fluorescent cresyl-violet labeling is overlaid in the top and middle panels to help identify tissue locations. Top panel, D2 mRNA is not induced in the mouse leptomeninges after LPS treatment but induced at several brain blood vessels (arrowheads). The inset shows a more intensely labeled blood vessel from the thalamus. Middle panel, Robust induction of D2 mRNA in the choroid plexus of the dorsal third ventricle. No signal is detected in control mice; several intensely labeled cells are present 2 hours after LPS, but only few remain by 9 hours (arrows). Bottom panel, Images of the retrosplenial cortex show a marked increase in parenchymal hybridization signal due to increased D2 mRNA production by astrocytes. Amy, amygdala; bv, blood vessel; cp, choroid plexus; Hab, habenular thalamic nucleus; Hip, hippocampus; Hyp, hypothalamus; opt, optic tract. Scale bar, 100 μm.
Figure 7.
Figure 7.
Effect of LPS administration on D2 activity in rats, mice, and Syrian hamsters. FM, leptomeninges from the basal forebrain; BM, brainstem leptomeninges; SCM, leptomeninges from the cervical spinal cord; LCP, lateral ventricle choroid plexus; 4CP, fourth ventricle choroid plexus; MBH, mediobasal hypothalamus; CP, choroid plexus. P < .001 for mouse FM+BM; P < .001 for mouse MBH; P < .0001 for all other samples.

References

    1. De Vito P, Incerpi S, Pedersen JZ, Luly P, Davis FB, Davis PJ. Thyroid hormones as modulators of immune activities at the cellular level. Thyroid. 2011;21:879–890 - PubMed
    1. Chen Y, Sjolinder M, Wang X, et al. Thyroid hormone enhances nitric oxide-mediated bacterial clearance and promotes survival after meningococcal infection. PLoS One. 2012;7:e41445. - PMC - PubMed
    1. Inan M, Koyuncu A, Aydin C, Turan M, Gokgoz S, Sen M. Thyroid hormone supplementation in sepsis: an experimental study. Surg Today. 2003;33:24–29 - PubMed
    1. Al-Abed Y, Metz CN, Cheng KF, et al. Thyroxine is a potential endogenous antagonist of macrophage migration inhibitory factor (MIF) activity. Proc Natl Acad Sci USA. 2011;108:8224–8227 - PMC - PubMed
    1. Gereben B, Zavacki AM, Ribich S, et al. Cellular and molecular basis of deiodinase-regulated thyroid hormone signaling. Endocr Rev. 2008;29:898–938 - PMC - PubMed

Publication types

MeSH terms