

Monitoring tumour response during chemo-radiotherapy: a parametric method using FDG-PET/CT images in patients with oesophageal cancer
- PMID: 24602385
- PMCID: PMC3973855
- DOI: 10.1186/2191-219X-4-12
Monitoring tumour response during chemo-radiotherapy: a parametric method using FDG-PET/CT images in patients with oesophageal cancer
Abstract
Background: The objective of this study is to investigate the feasibility and the additional interest of a parametric imaging (PI) method to monitor the early tumour metabolic response in a prospective series of oesophageal cancer patients who underwent positron emission tomography with fluoro-2-deoxy-d-glucose (FDG-PET/CT) before and during curative-intent chemo-radiotherapy.
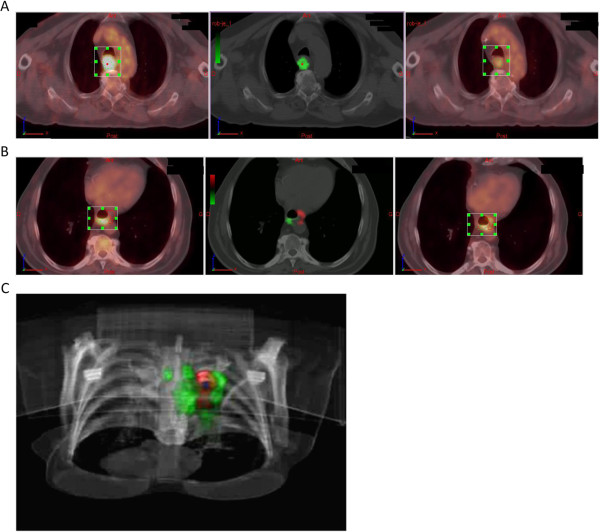
Methods: Fifty-seven patients with squamous cell carcinoma (SCC) of the oesophagus prospectively underwent FDG-PET/CT before chemo-radiotherapy (CRT) (PET1) and at 21 ± 3 days after the beginning of CRT (PET2). The outcome was assessed at 3 months and 1 year after the completion of CRT (clinical examination, CT scan or FDG-PET/CT, biopsy). For each patient, PET1 and PET2 were registered using CT images. The 2 PET image sets were subtracted, so the voxels with significant changes in FDG uptake were identified. A model-based analysis of this graph was used to identify the tumour voxels in which significant changes occurred between the two scans and yielded indices characterising these changes (green and red clusters). Quantitative parameters were compared with clinical outcome at 3 months and at 1 year.
Results: The baseline tumour FDG uptake decreased significantly at PET2 (p < 0.0001). The tumour volume significantly decreased between PET1 and PET2 (p < 0.02). The initial functional volume of the lesion (TV1) was significantly lower (p < 0.02) in patients in clinical response (CR) at 3 months and 1 year. The volume of the lesion during the treatment (TV2) was significantly lower in patients identified as in CR at 3 months (p < 0.03), but did not predict the outcome at 1 year. Multivariate analyses of outcome at 3 months showed that the risk of failure/death increased with younger age (p = 0.001), larger metabolic volume on PET1 (p = 0.009) and larger volume with decreased FDG uptake (p = 0.047). As for outcome at 1 year, the risk of failure/death increased with younger age (p = 0.006), nodal involvement (p = 0.08) and larger volumes with increased uptake (p = 0.03).
Conclusion: A parametric method to assess tumour response on serial FDG-PET performed during chemo-radiotherapy was evaluated. Early metabolic changes, i.e. variations in FDG uptake, provided additional prognostic information in multivariate analyses ClinicalTrials.gov NCT 00934505.
Trial registration: Current Controlled Trials ISRCTN7824458.
Figures
References
-
- Ben-Haim S, Ell P. 18 F-FDG PET and PET/CT in the evaluation of cancer treatment response. J Nucl Med. 2009;4(1):88–99. - PubMed
-
- Krause BJ, Herrmann K, Wieder H, Zum Buschenfelde CM. 18 F-FDG PET and 18 F-FDG PET/CT for assessing response to therapy in esophageal cancer. J Nucl Med. 2009;4(Suppl 1):89S–96S. - PubMed
-
- Choi NC, Fischman AJ, Niemierko A, Ryu JS, Lynch T, Wain J, Wright C, Fidias P, Mathisen D. Dose–response relationship between probability of pathologic tumor control and glucose metabolic rate measured with FDG PET after preoperative chemoradiotherapy in locally advanced non-small-cell lung cancer. Int J Radiat Oncol Biol Phys. 2002;4(4):1024–1035. - PubMed
-
- Mac Manus MP, Hicks RJ, Matthews JP, McKenzie A, Rischin D, Salminen EK, Ball DL. Positron emission tomography is superior to computed tomography scanning for response-assessment after radical radiotherapy or chemoradiotherapy in patients with non-small-cell lung cancer. J Clin Oncol. 2003;4(7):1285–1292. - PubMed
-
- Weber WA. Use of PET for monitoring cancer therapy and for predicting outcome. J Nucl Med. 2005;4(6):983–995. - PubMed
LinkOut - more resources
Full Text Sources
Other Literature Sources
Research Materials
Miscellaneous
