Comparative Study
. 2014 Sep;72(9):1773-87.
doi: 10.1016/j.joms.2014.01.004. Epub 2014 Jan 16.

Skeletal and soft tissue response to automated, continuous, curvilinear distraction osteogenesis

Affiliations
Comparative Study

Skeletal and soft tissue response to automated, continuous, curvilinear distraction osteogenesis

Zachary S Peacock et al. J Oral Maxillofac Surg. 2014 Sep.

Abstract

Purpose: To document the bone formation and soft tissue changes in response to automated, continuous, curvilinear distraction osteogenesis (DO) at rates greater than 1 mm/day in a minipig model.

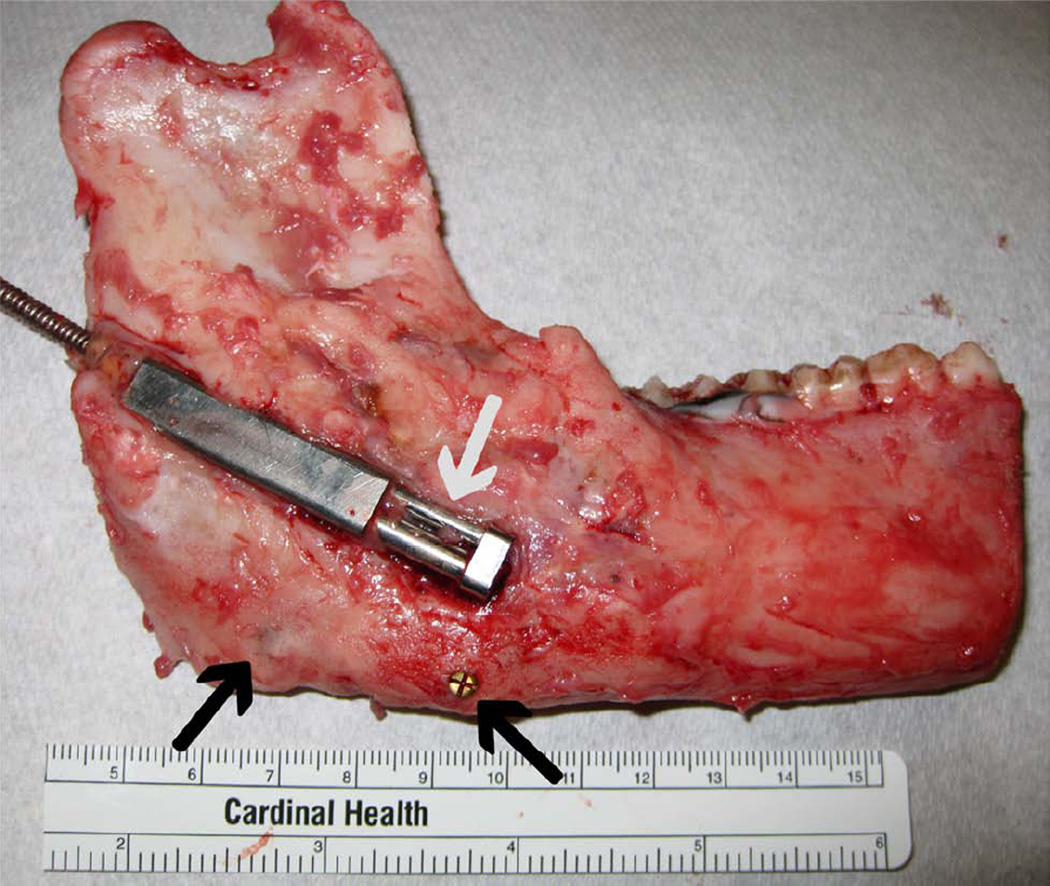
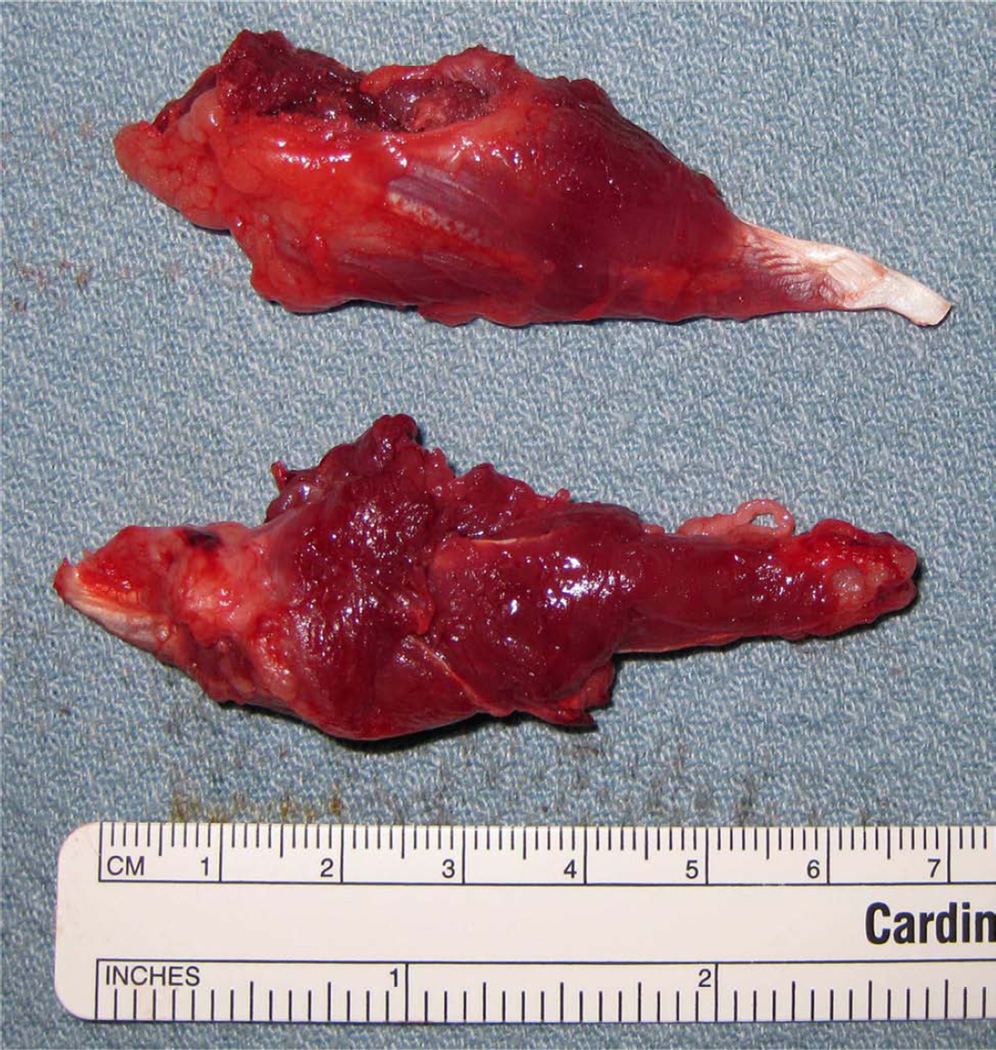
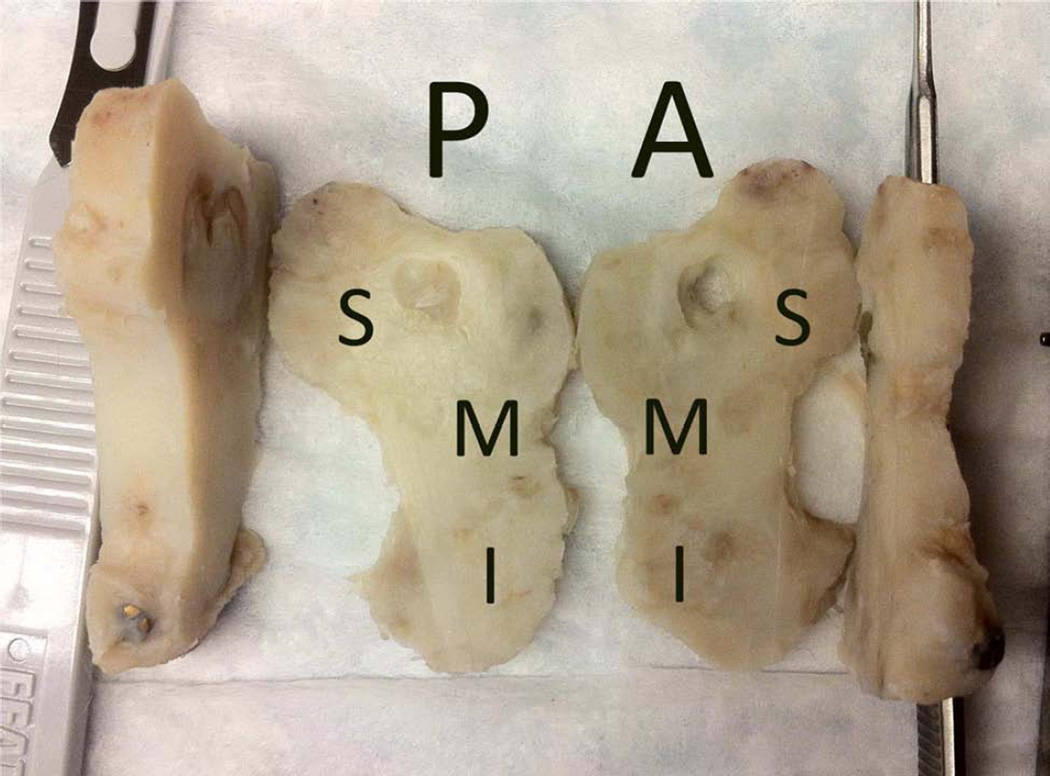
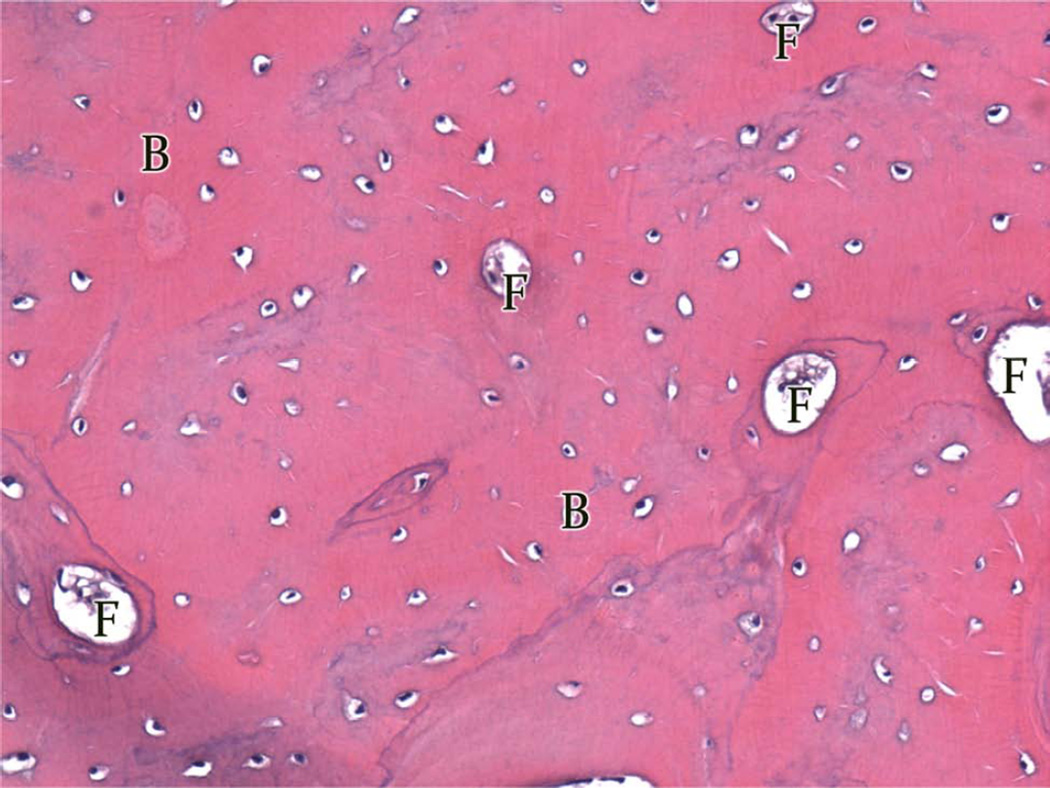
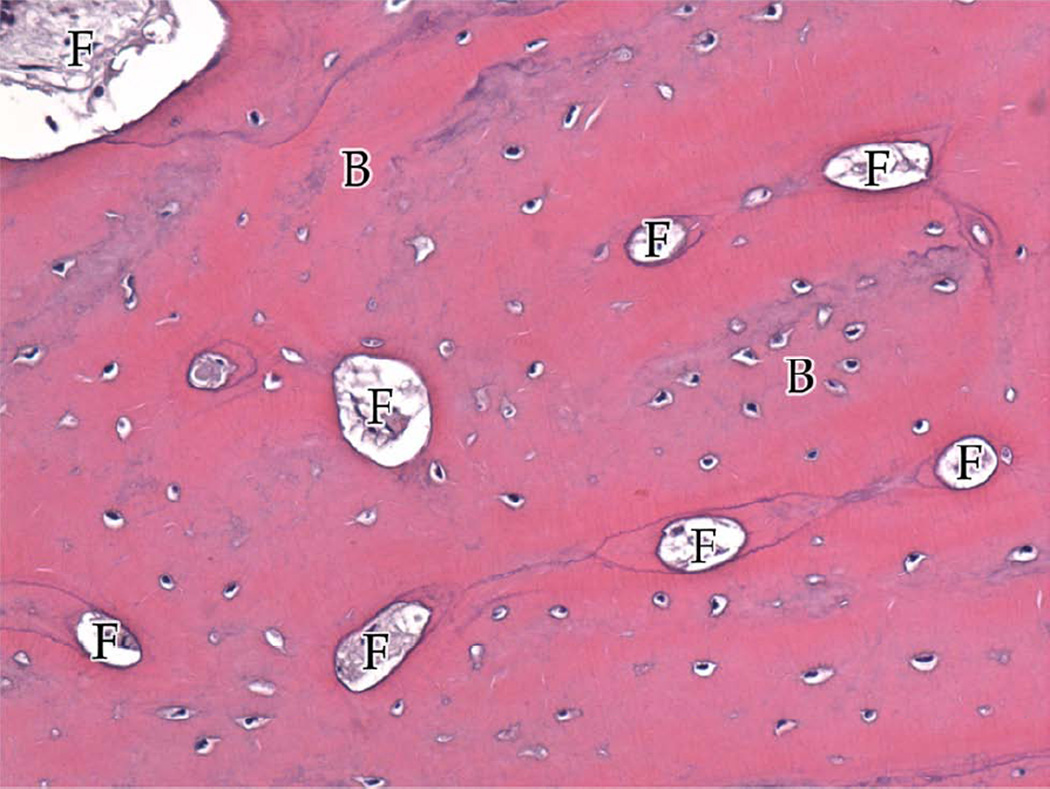
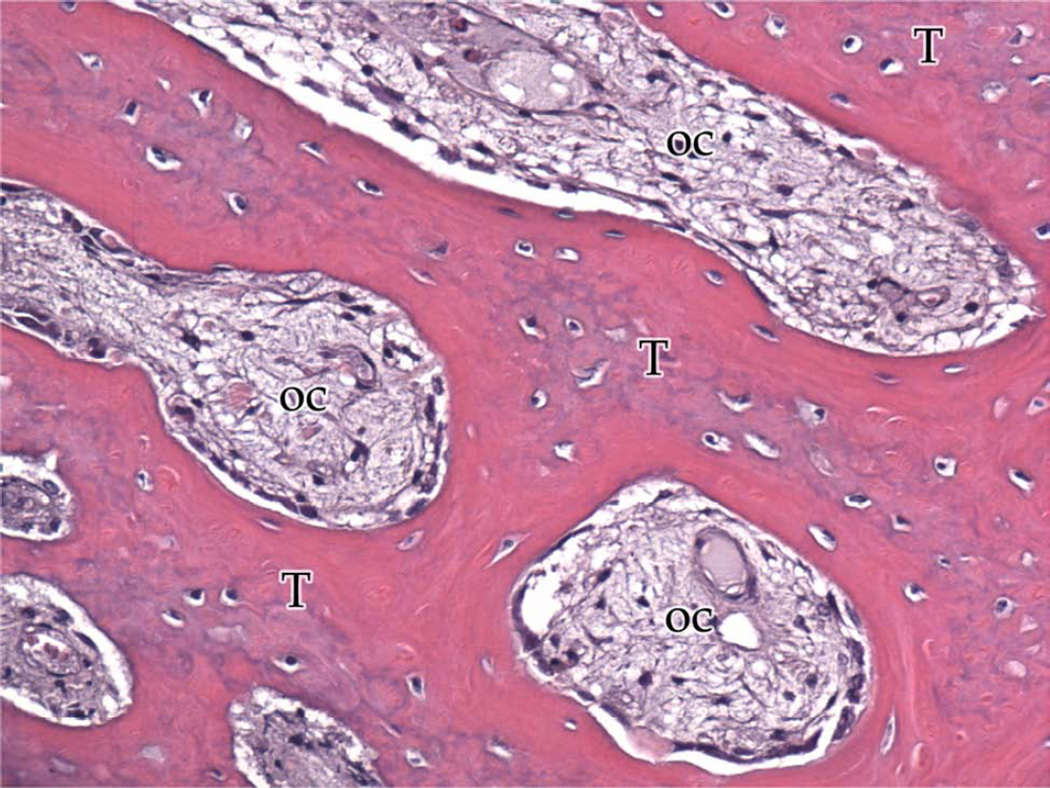
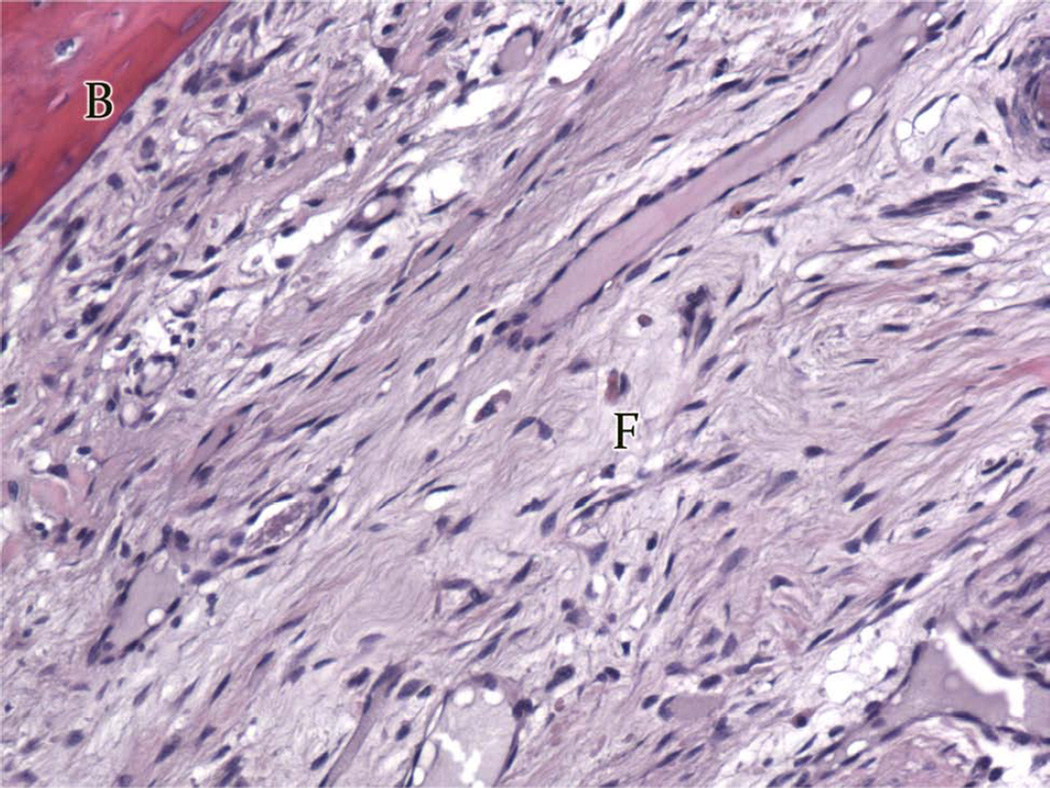
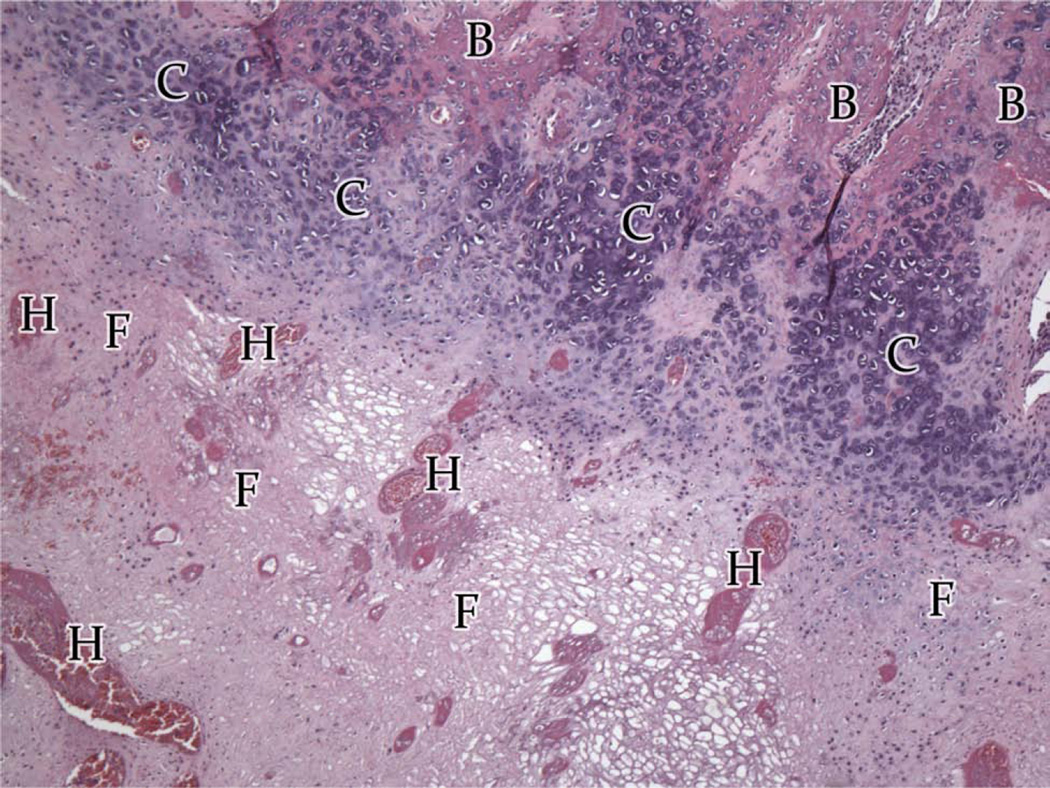
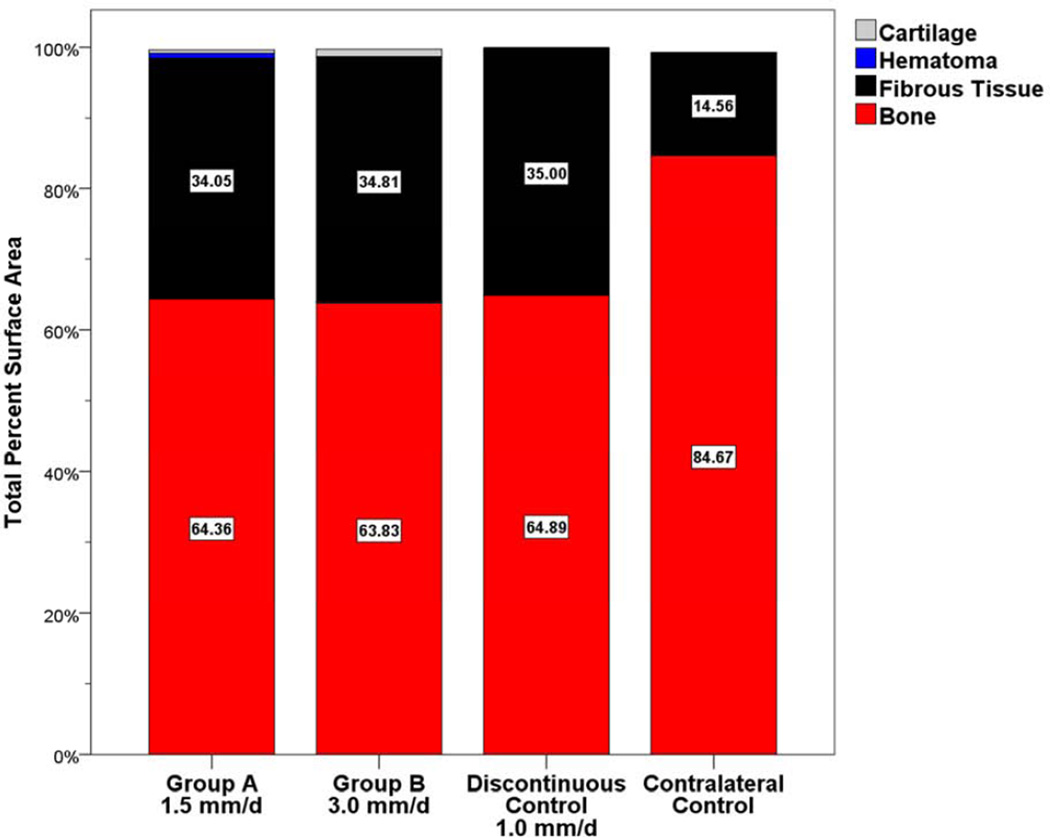
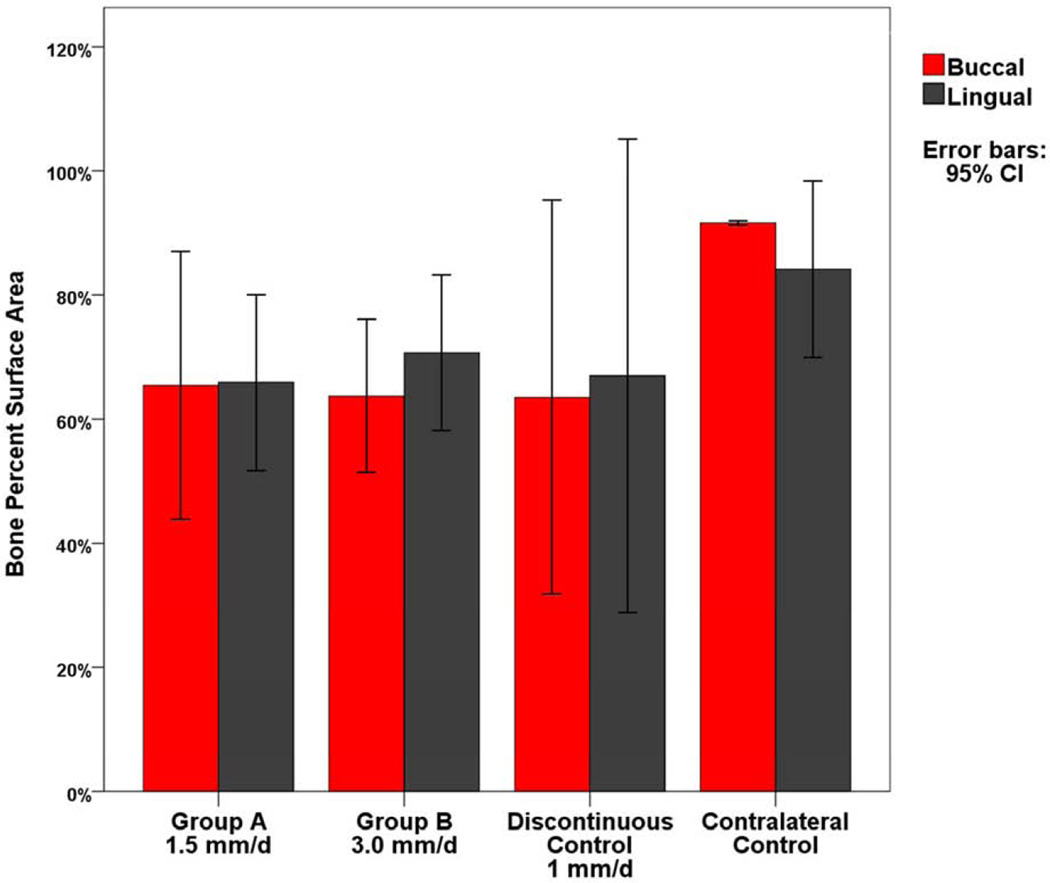
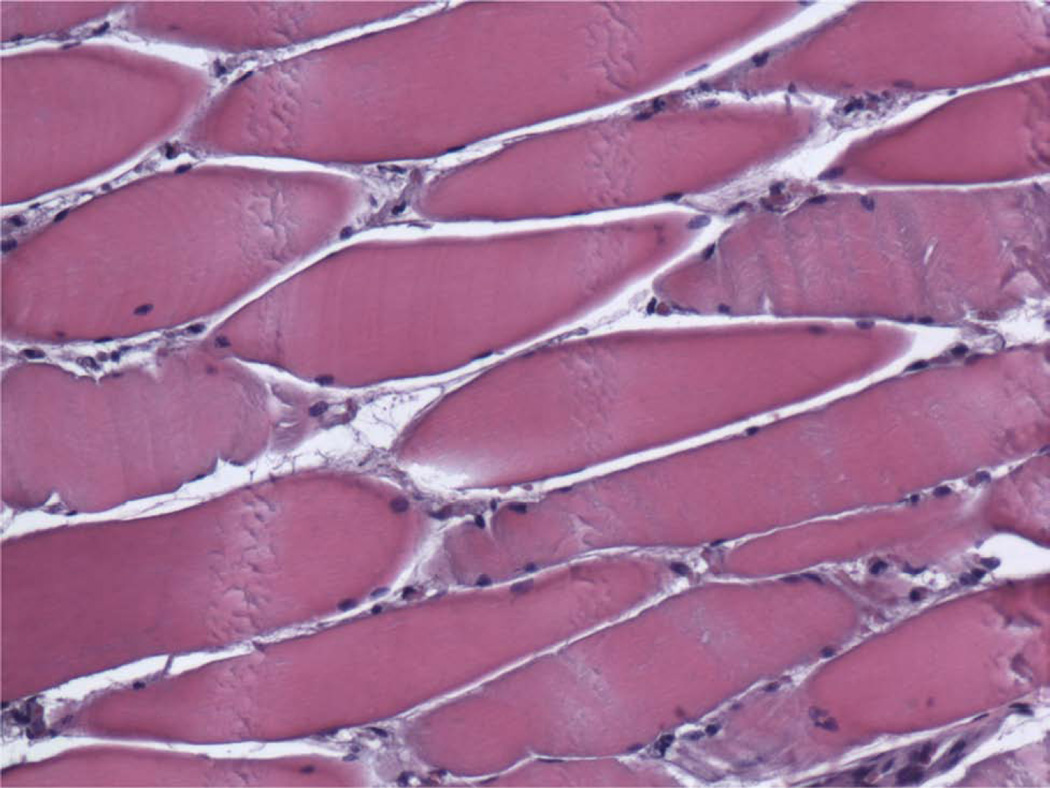
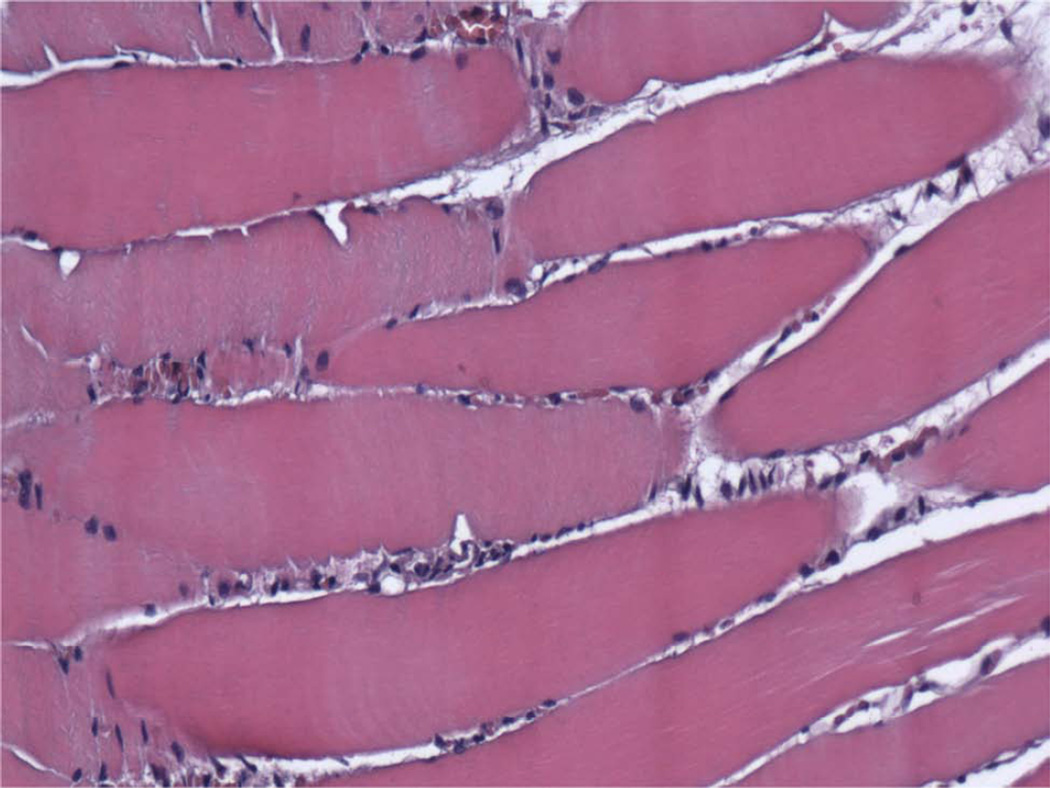
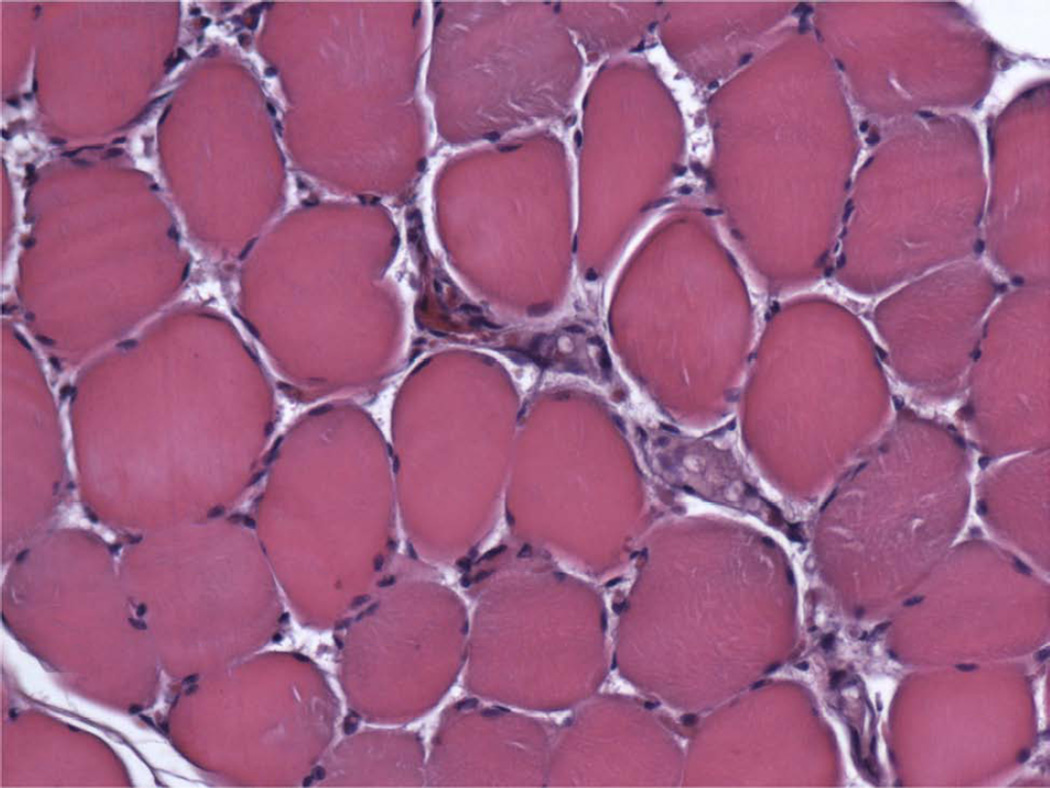
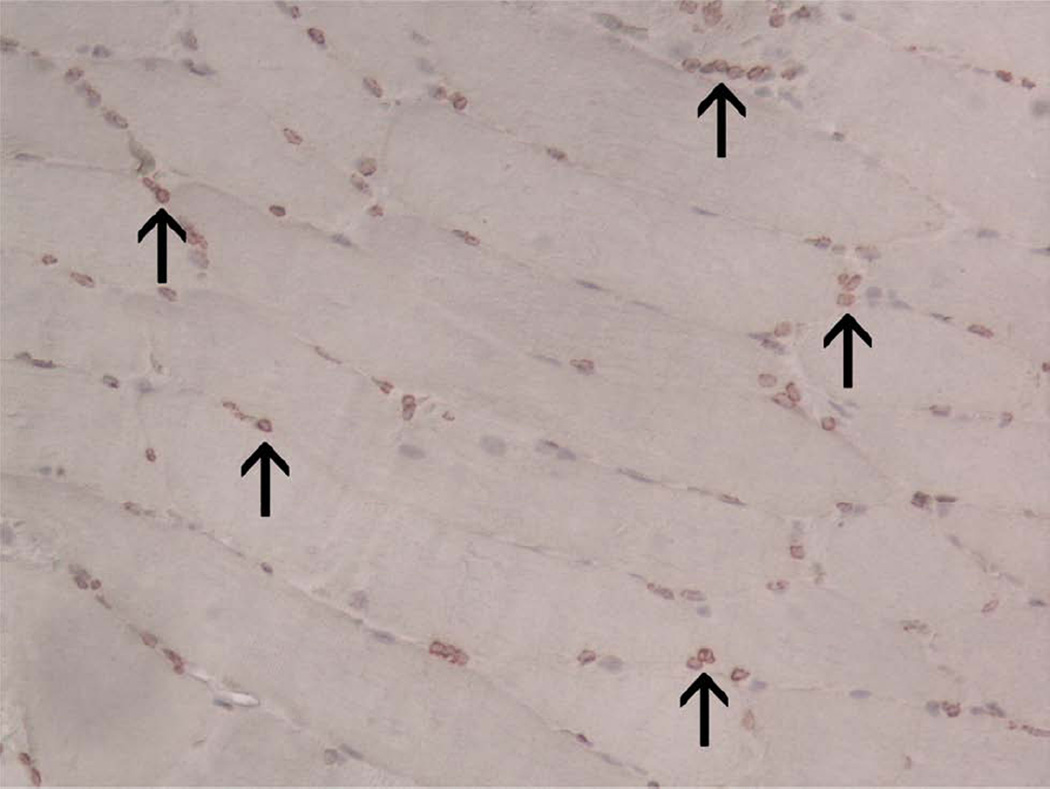
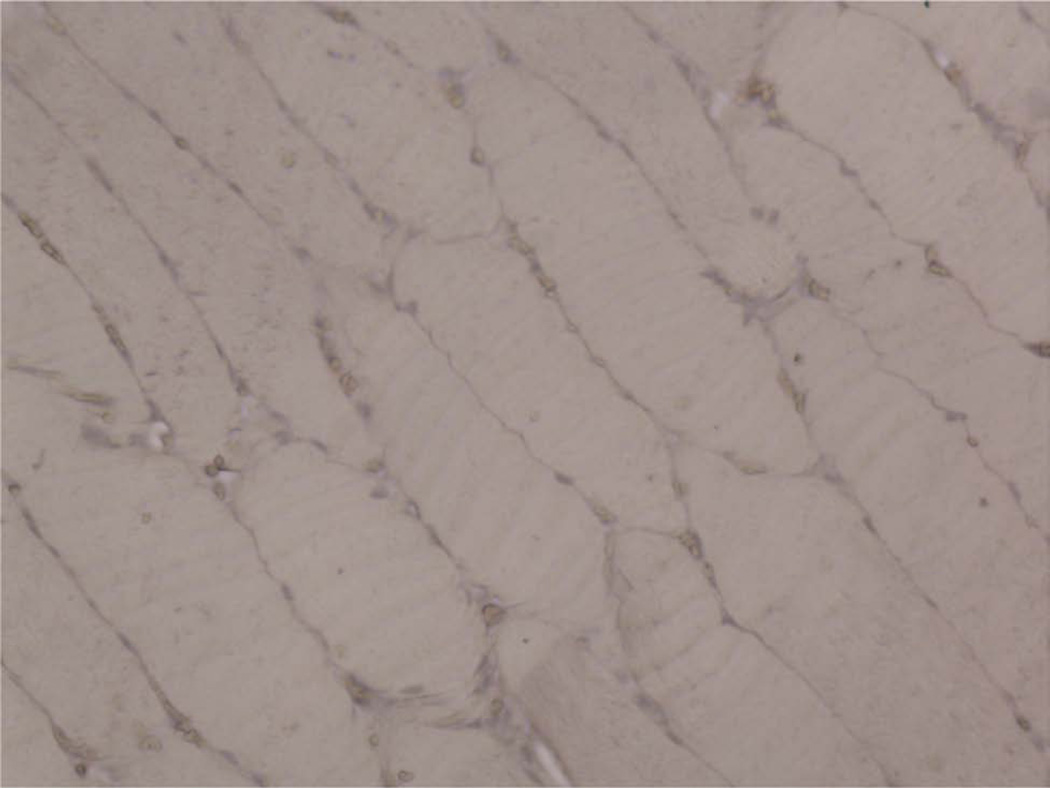
Materials and methods: Two groups of Yucatan minipigs underwent automated, continuous, curvilinear DO of the right mandible: group A, 1.5 mm/day (n = 5); and group B, 3.0 mm/day (n = 5). Each minipig underwent 12 mm of distraction followed by 24 days of fixation. The distracted and contralateral mandibles were harvested at the end of fixation. The percentage of surface area (PSA) of the regenerate occupied by bone, fibrous tissue, cartilage, and hematoma was determined using computerized histomorphometric analysis. The control groups consisted of DO wounds distracted discontinuously at 1 mm/day and the nonoperated contralateral mandible. The ipsilateral and contralateral digastric muscles were harvested and stained for proliferating cell nuclear antigen (PCNA), myogenic differentiation-1 (MyoD), and paired Box 7 protein (PAX7).

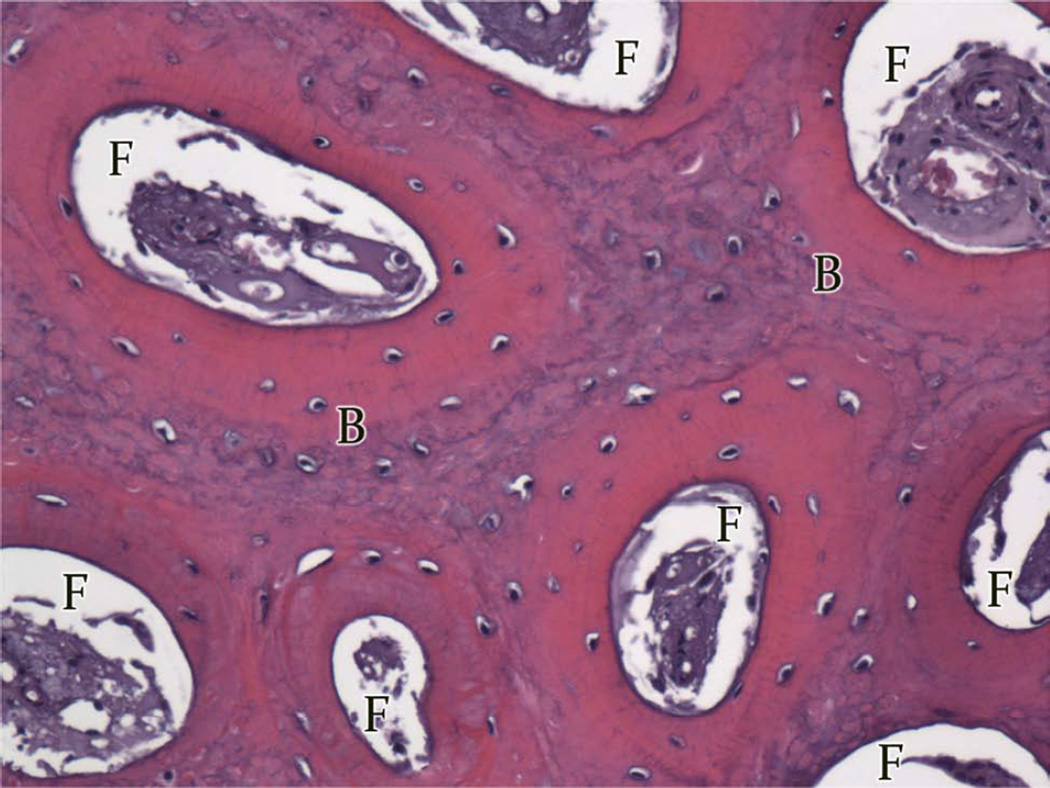
Results: All 10 minipigs completed the distraction and fixation period. The PSA occupied by bone was similar for groups A (PSA 64.36% ± 5.87%) and B (PSA 63.83% ± 3.37%) and the control group (1 mm/day; PSA 64.89% ± 0.56%) but was less than that on the nonoperated side (PSA 84.67% ± 0.86%). The PSA occupied by cartilage and hematoma in all groups was minimal (<1.1%). The digastric muscles had no abnormal tissue or inflammation, and PAX7, MyoD, and PCNA expression had returned to the baseline levels.

Conclusions: The results of the present study indicate that bone formation in response to automated, continuous, and curvilinear DO at a rate of 1.5 and 3.0 mm/day is nearly identical to that with discontinuous DO at 1 mm/day. In addition, no deleterious effects were found on the digastric muscles.


Figures

Figure 1
Figure 1
A, Intraoperative photograph with the distraction device fixed across the osteotomy with marker screws at inferior border (arrows). B, Harvested ex-vivo hemimandible with the distraction device opened 12 mm (arrows). C, Harvested ex-vivo ipsilateral and contralateral anterior digastric muscles. D, Coronally sectioned, decalcified regenerate with labeled superior (S), middle (M), inferior (I) thirds for the posterior (P) and anterior (A) sections.
Figure 1
Figure 1
A, Intraoperative photograph with the distraction device fixed across the osteotomy with marker screws at inferior border (arrows). B, Harvested ex-vivo hemimandible with the distraction device opened 12 mm (arrows). C, Harvested ex-vivo ipsilateral and contralateral anterior digastric muscles. D, Coronally sectioned, decalcified regenerate with labeled superior (S), middle (M), inferior (I) thirds for the posterior (P) and anterior (A) sections.
Figure 2
Figure 2
Group A, typical histologic images (H&E) of the regions of the regenerate (200×). A, Superior Region - minimal fibrous tissue (F) and abundant mature bone (B). B, Middle Region - small islands of fibrous stroma (F) in a background of dense bone (B). C, Inferior Region - ossification centers (OC) forming lamellar bone.
Figure 2
Figure 2
Group A, typical histologic images (H&E) of the regions of the regenerate (200×). A, Superior Region - minimal fibrous tissue (F) and abundant mature bone (B). B, Middle Region - small islands of fibrous stroma (F) in a background of dense bone (B). C, Inferior Region - ossification centers (OC) forming lamellar bone.
Figure 3
Figure 3
Group B, typical histologic images (H&E) of the regions of the regenerate (200×). A, Superior Region - minimal fibrous tissue (F) and abundant mature bone (B).B, Middle Region - small islands of fibrous stroma (F) in a background of dense bone (B). C, Inferior Region - bony trabeculae (T) spread throughout several ossification centers (OC).
Figure 3
Figure 3
Group B, typical histologic images (H&E) of the regions of the regenerate (200×). A, Superior Region - minimal fibrous tissue (F) and abundant mature bone (B).B, Middle Region - small islands of fibrous stroma (F) in a background of dense bone (B). C, Inferior Region - bony trabeculae (T) spread throughout several ossification centers (OC).
Figure 4
Figure 4
Group A and B, atypical histologic images (H&E) of the regions of the regenerate. Variations from the average, A, Superior third - cartilage nests (C) flanked by fibrous tissue (F) and dense bone (B) (200×). B, Middle region – large islands of fibrous tissue amongst maturing bone (200×). C, Inferior Region - the regenerate in presence of infection (Animal #3-079). Large intermixed areas of hematoma (H), cartilage (C), and fibrous tissue (F) with small regions of bone (B) (40×).
Figure 4
Figure 4
Group A and B, atypical histologic images (H&E) of the regions of the regenerate. Variations from the average, A, Superior third - cartilage nests (C) flanked by fibrous tissue (F) and dense bone (B) (200×). B, Middle region – large islands of fibrous tissue amongst maturing bone (200×). C, Inferior Region - the regenerate in presence of infection (Animal #3-079). Large intermixed areas of hematoma (H), cartilage (C), and fibrous tissue (F) with small regions of bone (B) (40×).
Figure 5
Figure 5
Total PSA occupied by bone, fibrous tissue, hematoma, or cartilage. Similar PSA occupied by bone was observed between Group A (64.36%), Group B (63.83%), and the Discontinuous Control (64.89%). No statistical difference was found between Group A, Group B, or the Discontinuous Control.
Figure 6
Figure 6
PSA occupied by bone for the superior, middle, and inferior regions. 95% confidence interval error bars. No statistical difference was found between Group A, Group B, or the Discontinuous Control between each region.
Figure 7
Figure 7
PSA occupied by bone for the buccal and lingual regions. 95% confidence interval error bars. No statistical difference was found between Group A, Group B, or the Discontinuous Control between each region.
Figure 7
Figure 7
PSA occupied by bone for the buccal and lingual regions. 95% confidence interval error bars. No statistical difference was found between Group A, Group B, or the Discontinuous Control between each region.
Figure 7
Figure 7
PSA occupied by bone for the buccal and lingual regions. 95% confidence interval error bars. No statistical difference was found between Group A, Group B, or the Discontinuous Control between each region.
Figure 8
Figure 8
PSA occupied by bone for the endosteum and periosteum. 95% confidence interval error bars. No statistical difference was found between Group A, Group B, or the Discontinuous Control between each region.
Figure 9
Figure 9
Photomicrographs (H&E) of ipsilateral digastric muscles following automated, continuous DO with no abnormal tissue present (200×). A, Group A, longitudinal section, B, Group B, longitudinal specimen, C, Group A, cross-sectional specimen, D, Group B, cross-sectional specimen.
Figure 9
Figure 9
Photomicrographs (H&E) of ipsilateral digastric muscles following automated, continuous DO with no abnormal tissue present (200×). A, Group A, longitudinal section, B, Group B, longitudinal specimen, C, Group A, cross-sectional specimen, D, Group B, cross-sectional specimen.
Figure 9
Figure 9
Photomicrographs (H&E) of ipsilateral digastric muscles following automated, continuous DO with no abnormal tissue present (200×). A, Group A, longitudinal section, B, Group B, longitudinal specimen, C, Group A, cross-sectional specimen, D, Group B, cross-sectional specimen.
Figure 9
Figure 9
Photomicrographs (H&E) of ipsilateral digastric muscles following automated, continuous DO with no abnormal tissue present (200×). A, Group A, longitudinal section, B, Group B, longitudinal specimen, C, Group A, cross-sectional specimen, D, Group B, cross-sectional specimen.
Figure 10
Figure 10
Immunohistochemical staining of ipsilateral digastric muscle for PAX7 (A), MyoD (B), and PCNA (C). Strong, red intranuclear staining was expectedly only observed for PAX7 (arrow) (200×).

References

    1. McCarthy JG, Schreiber J, Karp N, Thorne CH, Grayson BH. Lengthening the human mandible by gradual distraction. Plast Reconstr Surg. 1992;89:1. - PubMed
    1. Swennen G, Schliephake H, Dempf R, Schierle H, Malevez C. Craniofacial distraction osteogenesis: a review of the literature: Part 1: clinical studies. Int J Oral Maxillofac Surg. 2001;30:89. - PubMed
    1. Goldwaser BR, Magill J, Papadaki ME, Byl M, Kromann R, Yates B, Morency J, Kaban LB, Troulis MJ. Continuous mandibular distraction osteogenesis: novel device and preliminary results in minipigs. J Oral Maxillofac Surg. 2013;71:e168. - PubMed
    1. Ilizarov GA. The principles of the Ilizarov method. Bull Hosp Jt Dis Orthop Inst. 1988;48:1. - PubMed
    1. Ilizarov GA. The tension-stress effect on the genesis and growth of tissues: Part II. The influence of the rate and frequency of distraction. Clin Orthop Relat Res. 1989:263. - PubMed

Publication types

MeSH terms

Substances