. 2014 Mar 6;10(3):e1004182.
doi: 10.1371/journal.pgen.1004182. eCollection 2014 Mar.

The first steps of adaptation of Escherichia coli to the gut are dominated by soft sweeps

Affiliations

The first steps of adaptation of Escherichia coli to the gut are dominated by soft sweeps

João Barroso-Batista et al. PLoS Genet. .

Abstract

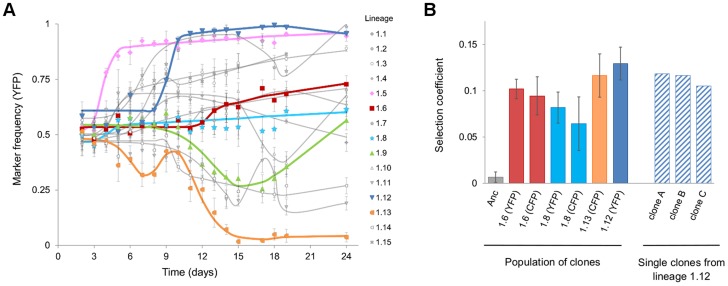
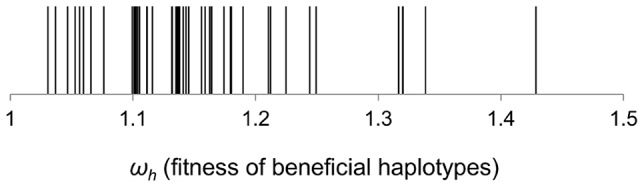
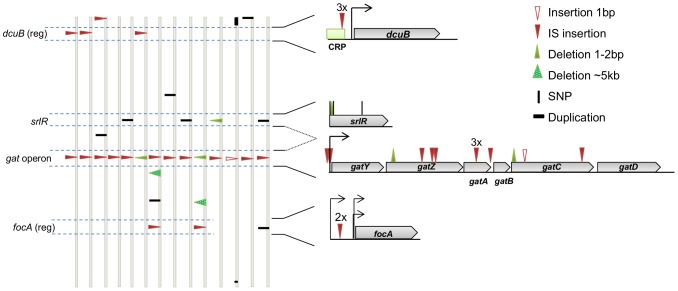
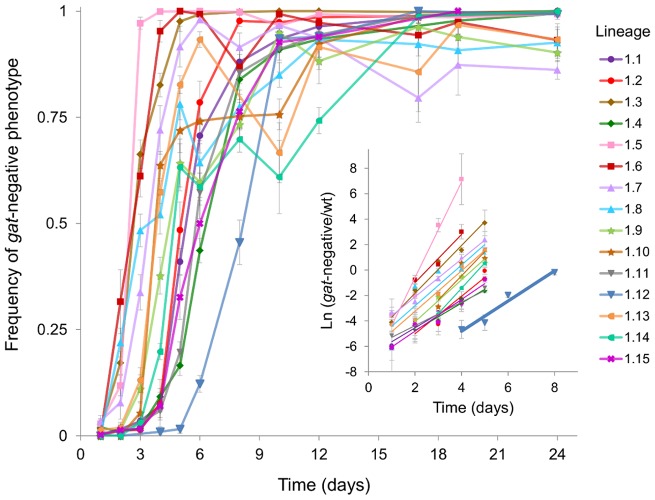
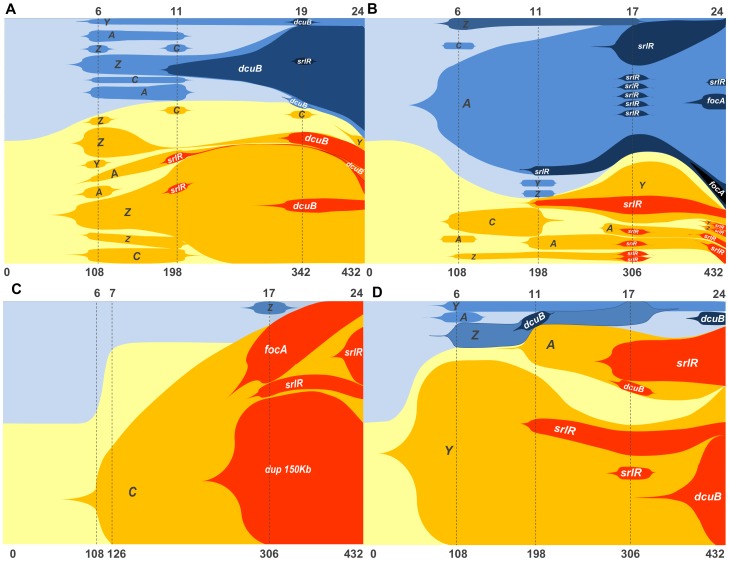
The accumulation of adaptive mutations is essential for survival in novel environments. However, in clonal populations with a high mutational supply, the power of natural selection is expected to be limited. This is due to clonal interference--the competition of clones carrying different beneficial mutations--which leads to the loss of many small effect mutations and fixation of large effect ones. If interference is abundant, then mechanisms for horizontal transfer of genes, which allow the immediate combination of beneficial alleles in a single background, are expected to evolve. However, the relevance of interference in natural complex environments, such as the gut, is poorly known. To address this issue, we have developed an experimental system which allows to uncover the nature of the adaptive process as Escherichia coli adapts to the mouse gut. This system shows the invasion of beneficial mutations in the bacterial populations and demonstrates the pervasiveness of clonal interference. The observed dynamics of change in frequency of beneficial mutations are consistent with soft sweeps, where different adaptive mutations with similar phenotypes, arise repeatedly on different haplotypes without reaching fixation. Despite the complexity of this ecosystem, the genetic basis of the adaptive mutations revealed a striking parallelism in independently evolving populations. This was mainly characterized by the insertion of transposable elements in both coding and regulatory regions of a few genes. Interestingly, in most populations we observed a complete phenotypic sweep without loss of genetic variation. The intense clonal interference during adaptation to the gut environment, here demonstrated, may be important for our understanding of the levels of strain diversity of E. coli inhabiting the human gut microbiota and of its recombination rate.


Conflict of interest statement

The authors have declared that no competing interests exist.

Figures

Figure 1
Figure 1. Evidence for rapid adaptation and CI in vivo.
A) Dynamics of marker frequency (with 95% confidence intervals) during the adaptation of E. coli to the gut upon colonization (populations 1.1 to 1.15). The predictions of the simplest model of Darwinian selection , for each set of data points are shown as lines. The lines correspond to the model that assumes multiple beneficial mutations (i = 1,2,5) can occur in a given clone at a given time (Tbi), and these clones have a given fitness (Wi). Tbi and Wi are fitted by maximum likelihood and the best model, in terms of number of mutations, is chosen according to Akaike criteria. Representative examples of trajectories for the classical signature of a selective sweep (populations 1.5, 1.12 and 1.13) and for the maintenance of neutral diversity under with intense CI (populations 1.6, 1.8 and 1.9) are shown in colours. B) Direct evidence for adaptation and CI: the bars represent the mean selection coefficient (±2 s.e.m, n = 3) from an in vivo competitive fitness assay between evolved and ancestral clones. The first bar shows the neutrality of the fluorescent marker. The following six bars represent the results from competitions of a mixture of thirty clones (with a given fluorescent marker, indicated below the bar) isolated from the respective population (indicated below each bar). Both CFP and YFP mixtures of clones from lineages 1.6 and 1.8 show similar levels of adaptation, consistent with intense CI maintaining a high frequency of both neutral markers. The dashed bars show the results of competitions (n = 2) of single clones isolated from lineage 1.12.
Figure 2
Figure 2. Distribution of fitness effects of beneficial haplotypes that contributed to adaptation.
The fitness of beneficial haplotypes (ωh) was estimated under a theoretical model which assumes the minimum number of beneficial mutations required to explain the marker dynamics.
Figure 3
Figure 3. The genetic basis of adaptive mutations and the level of parallelism between populations.
Identified mutations in clones isolated from populations 1.1 to 1.14 (evolved in vivo for 24 days), represented along the E. coli chromosome. For simplicity, the genomes are represented linearly and vertically drawn. The type and position of mutations are shown by triangles for insertions and deletions, small vertical bars denote single nucleotide polymorphisms (SNPs), and one duplication in clone number 1.12 is depicted as a horizontal bar. See the symbol legend for other events. The genes dcuB, srlR and focA and one operon (gat) are highlighted. These represent regions of parallel mutation in at least two genomes. The genomic context of these mutations is represented on the right. (reg) after the gene name, means that the regulatory region, rather than the coding region, was affected. Numbers above marked mutations represent the number of times a particular mutation was detected at the same position.
Figure 4
Figure 4. Emergence and spread of beneficial mutations in the gat operon.
Dynamics of frequency change of the gat-negative phenotype over time are shown for all populations (1.1 to 1.15). Inset: The natural logarithm of the ratio of gat-negative individuals to wild type over the first 5 days of adaptation is shown as dots. Each group of points was fitted to a linear regression (represented as lines). Highlighted in bold is the population 1.12 for which the slope corresponds to an estimate of the selection coefficient of 0.075±0.01 (per generation).
Figure 5
Figure 5. Graphic representation of the frequencies of newly generated haplotypes along 24 days (corresponding to 432 generations) of evolution inside the mouse gut (see Tables S3 to S6 for numeric data).
Shaded areas are proportional to the relative abundance of each haplotype. Yellow and blue shaded areas represent the two sub-populations of bacteria labeled either with cfp or yfp alleles. The ancestry relations between haplotypes can be inferred by the accumulation of new mutations in a previously existent genotype. Dash lines mark the time points in days (upper axis) or generations (lower axis) where the sampling took place. For the top two populations 1.1 (A) and 1.11 (B), 40 clones were sampled in each time point. For the bottom two populations 1.12 (C) and 1.5 (D) 20 clones were sampled in each time point.

References

    1. Atwood KC, Schneider LK, Ryan FJ (1951) Periodic selection in Escherichia coli . Proc Natl Acad Sci USA 37: 146–155. - PMC - PubMed
    1. Hegreness M, Shoresh N, Hartl D, Kishony R (2006) An equivalence principle for the incorporation of favorable mutations in asexual populations. Science 311: 1615–1617 doi:311/5767/1615 - PubMed
    1. Kao KC, Sherlock G (2008) Molecular characterization of clonal interference during adaptive evolution in asexual populations of Saccharomyces cerevisiae . Nature Genet 40: 1499–1504 doi:ng.280 - PMC - PubMed
    1. Maharjan R, Seeto S, Notley-McRobb L, Ferenci T (2006) Clonal adaptive radiation in a constant environment. Science 313: 514–517 doi:10.1126/science.1129865 - DOI - PubMed
    1. Perfeito L, Fernandes L, Mota C, Gordo I (2007) Adaptive mutations in bacteria: high rate and small effects. Science 317: 813–815 doi:317/5839/813 - PubMed

Publication types

LinkOut - more resources