Vectorial capacity of Aedes aegypti: effects of temperature and implications for global dengue epidemic potential
- PMID: 24603439
- PMCID: PMC3946027
- DOI: 10.1371/journal.pone.0089783
Vectorial capacity of Aedes aegypti: effects of temperature and implications for global dengue epidemic potential
Abstract
Dengue is a mosquito-borne viral disease that occurs mainly in the tropics and subtropics but has a high potential to spread to new areas. Dengue infections are climate sensitive, so it is important to better understand how changing climate factors affect the potential for geographic spread and future dengue epidemics. Vectorial capacity (VC) describes a vector's propensity to transmit dengue taking into account human, virus, and vector interactions. VC is highly temperature dependent, but most dengue models only take mean temperature values into account. Recent evidence shows that diurnal temperature range (DTR) plays an important role in influencing the behavior of the primary dengue vector Aedes aegypti. In this study, we used relative VC to estimate dengue epidemic potential (DEP) based on the temperature and DTR dependence of the parameters of A. aegypti. We found a strong temperature dependence of DEP; it peaked at a mean temperature of 29.3°C when DTR was 0°C and at 20°C when DTR was 20°C. Increasing average temperatures up to 29°C led to an increased DEP, but temperatures above 29°C reduced DEP. In tropical areas where the mean temperatures are close to 29°C, a small DTR increased DEP while a large DTR reduced it. In cold to temperate or extremely hot climates where the mean temperatures are far from 29°C, increasing DTR was associated with increasing DEP. Incorporating these findings using historical and predicted temperature and DTR over a two hundred year period (1901-2099), we found an increasing trend of global DEP in temperate regions. Small increases in DEP were observed over the last 100 years and large increases are expected by the end of this century in temperate Northern Hemisphere regions using climate change projections. These findings illustrate the importance of including DTR when mapping DEP based on VC.
Conflict of interest statement
Figures

 , and
, and  ; bottom row:
  ,
,  , and
, and  . Average daily temperature (the horizontal axis) and DTR (the vertical axis) both have units of °C. The color bar on the right side of each graph describes the value of the parameter. A higher
  corresponds to a greater dengue epidemic potential.
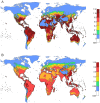
 is averaged over the highest three consecutive months of the year from 1980 to 2009. The color bar describes the values of the
  .
.
 .
.
 .
.
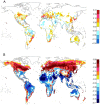
 based on 30 year averages of temperature and DTR. A) Differences between 1980–2009 and 1901–1930. B) Differences between 2070–2099 and 1980–2009. The mean value of
  was averaged from five global climate models under RCP8.5. The color bar describes the values of the
  .
.
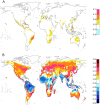
 based on 30-year averages of temperature and DTR. A) Differences between 1980–2009 and 1901–1930. B) Differences between 2070–2099 and 1980–2009. The mean value of
  was averaged from five global climate models under RCP8.5. The color bar describes the values of the
  .
.References
-
- World Health Organization (WHO) (2012) Dengue and severe dengue – Fact sheet N°117. Available: http://www.who.int/mediacentre/factsheets/fs117/en/#. Accessed 03 December 2012.
-
- Randolph SE, Rogers DJ (2010) The arrival, establishment and spread of exotic diseases: patterns and predictions. Nat Rev Microbiol 8: 361–371. - PubMed
-
- Reiter P (2010) Yellow fever and dengue: a threat to Europe? Euro Surveill 15: 19509. - PubMed
Publication types
MeSH terms
LinkOut - more resources
Full Text Sources
Other Literature Sources
Medical

