

Genetic basis of metabolome variation in yeast
- PMID: 24603560
- PMCID: PMC3945093
- DOI: 10.1371/journal.pgen.1004142
Genetic basis of metabolome variation in yeast
Abstract
Metabolism, the conversion of nutrients into usable energy and biochemical building blocks, is an essential feature of all cells. The genetic factors responsible for inter-individual metabolic variability remain poorly understood. To investigate genetic causes of metabolome variation, we measured the concentrations of 74 metabolites across ~ 100 segregants from a Saccharomyces cerevisiae cross by liquid chromatography-tandem mass spectrometry. We found 52 quantitative trait loci for 34 metabolites. These included linkages due to overt changes in metabolic genes, e.g., linking pyrimidine intermediates to the deletion of ura3. They also included linkages not directly related to metabolic enzymes, such as those for five central carbon metabolites to ira2, a Ras/PKA pathway regulator, and for the metabolites, S-adenosyl-methionine and S-adenosyl-homocysteine to slt2, a MAP kinase involved in cell wall integrity. The variant of ira2 that elevates metabolite levels also increases glucose uptake and ethanol secretion. These results highlight specific examples of genetic variability, including in genes without prior known metabolic regulatory function, that impact yeast metabolism.
Conflict of interest statement
The authors have declared that no competing interests exist.
Figures
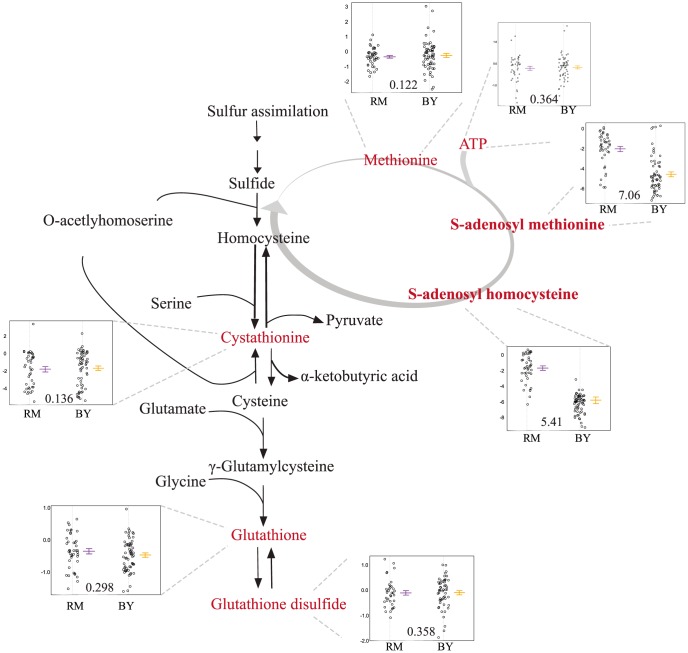
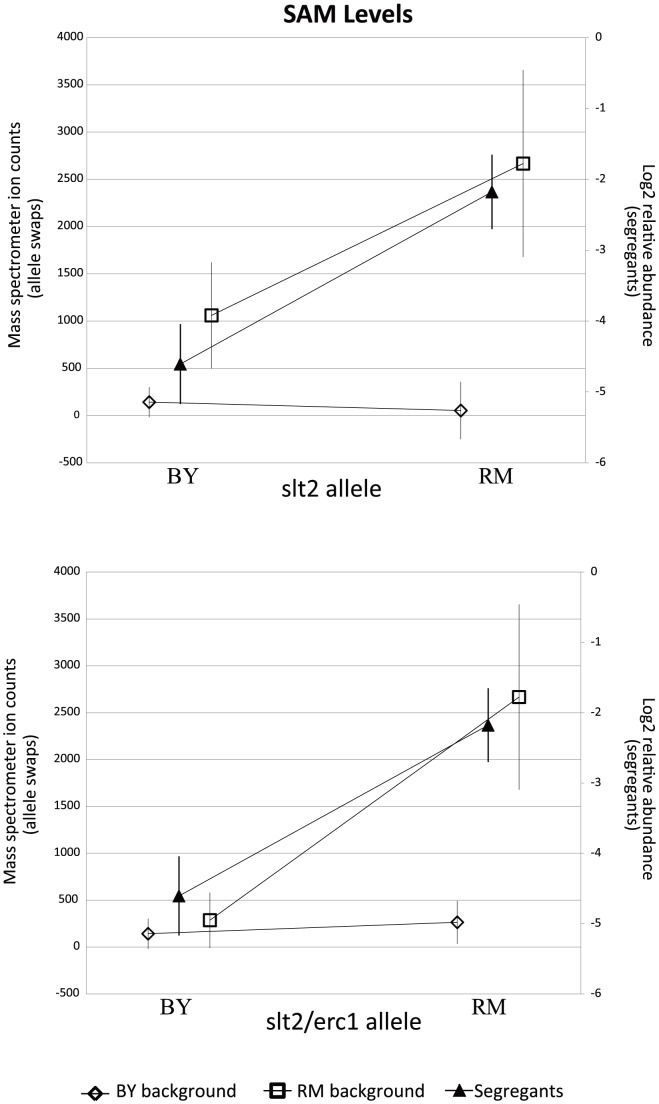
 standard error) of SAM are plotted based upon the allele of slt2 (top) and slt2 and erc1 (bottom). Mass spectrometer ion counts for BY background (diamonds) and RM background (squares) are shown on the left axis while segregants' log2 relative abundances (triangles) are indicated on the right axis.
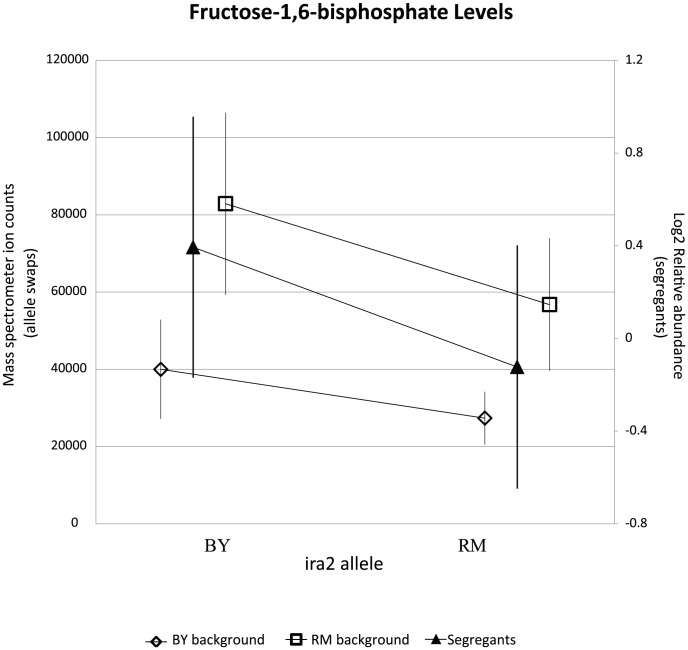
 standard error) of FBP are plotted based upon the allele of ira2. Mass spectrometer ion counts for BY background (diamonds) and RM background (squares) are shown on the left axis while segregants' log2 relative abundances (triangles) are indicated on the right axis.
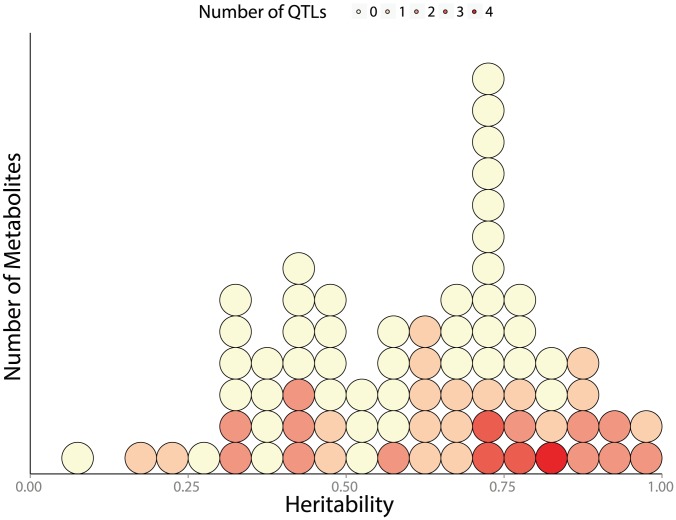
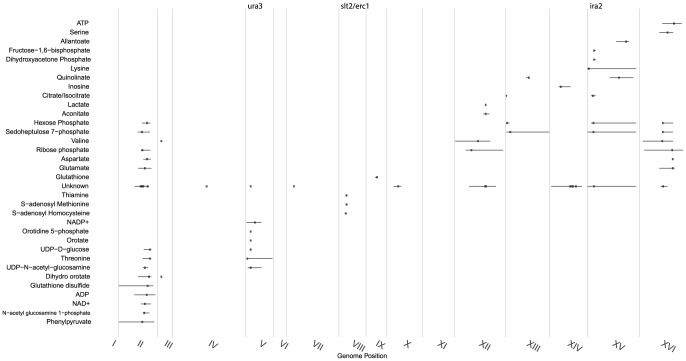
 ) across measured metabolites. each circle represents a single metabolite, colored according to how many QTLs are associated with its abundance. 114 metabolites are shown: 74 known metabolites with 52 detected mQTL and 42 unknown metabolites (with known m/z, but unknown identity) associated with 20 additional mQTLs.
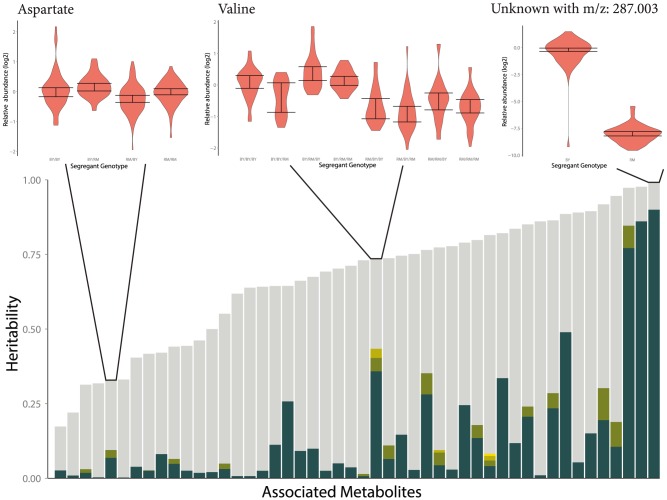
References
-
- Bijlsma S, Bobeldijk I, Verheij ER, Ramaker R (2006) Large-scale human metabolomics studies: a strategy for data (pre-) processing and validation. Analytical Chemistry 78: 567–574. - PubMed
-
- Sladek R, Rocheleau G, Rung J, Dina C, Shen L, et al. (2007) A genome-wide association study identifies novel risk loci for type 2 diabetes. Nature 445: 881–885. - PubMed
-
- Marchesi JR, Holmes E, Khan F, Kochhar S, Scanlan P, et al. (2007) Rapid and noninvasive metabonomic characterization of inflammatory bowel disease. Journal of proteome research 6: 546–551. - PubMed
-
- Swiegers JH, Pretorius IS (2005) Yeast Modulation of Wine Flavor. In: Advances in applied microbiology, Elsevier. pp. 131–175. - PubMed
-
- Keasling JD, Chou H (2008) Metabolic engineering delivers next-generation biofuels. Nature Publishing Group 26: 298–299. - PubMed
Publication types
MeSH terms
Grants and funding
LinkOut - more resources
Full Text Sources
Other Literature Sources
Molecular Biology Databases
