. 2014 Mar 6;10(3):e1004155.
doi: 10.1371/journal.pgen.1004155. eCollection 2014 Mar.

Genome-wide analysis of SREBP1 activity around the clock reveals its combined dependency on nutrient and circadian signals

Collaborators, Affiliations

Genome-wide analysis of SREBP1 activity around the clock reveals its combined dependency on nutrient and circadian signals

Federica Gilardi et al. PLoS Genet. .

Abstract

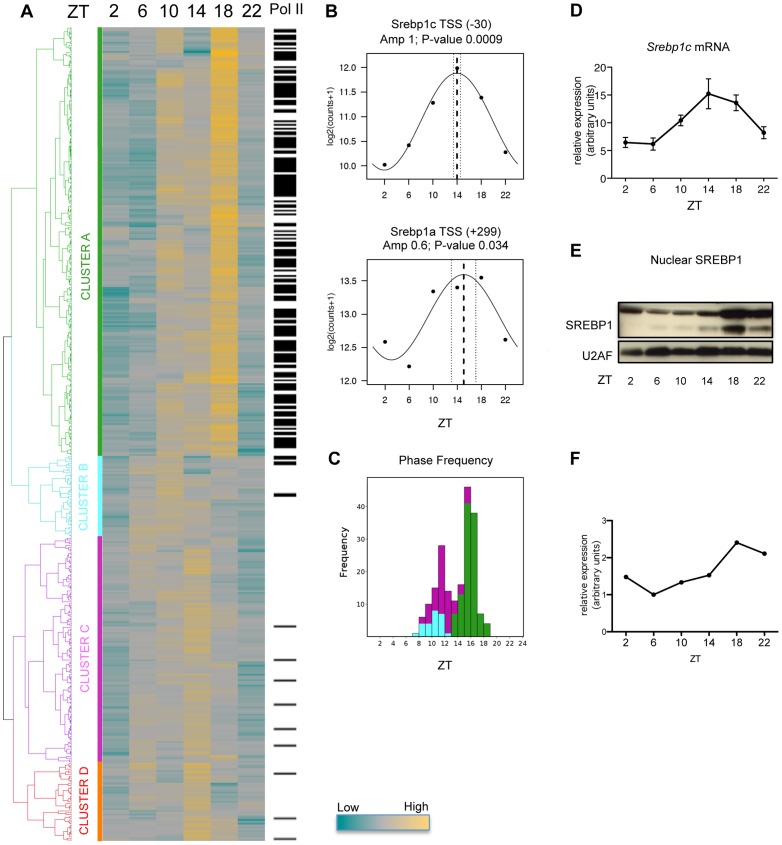
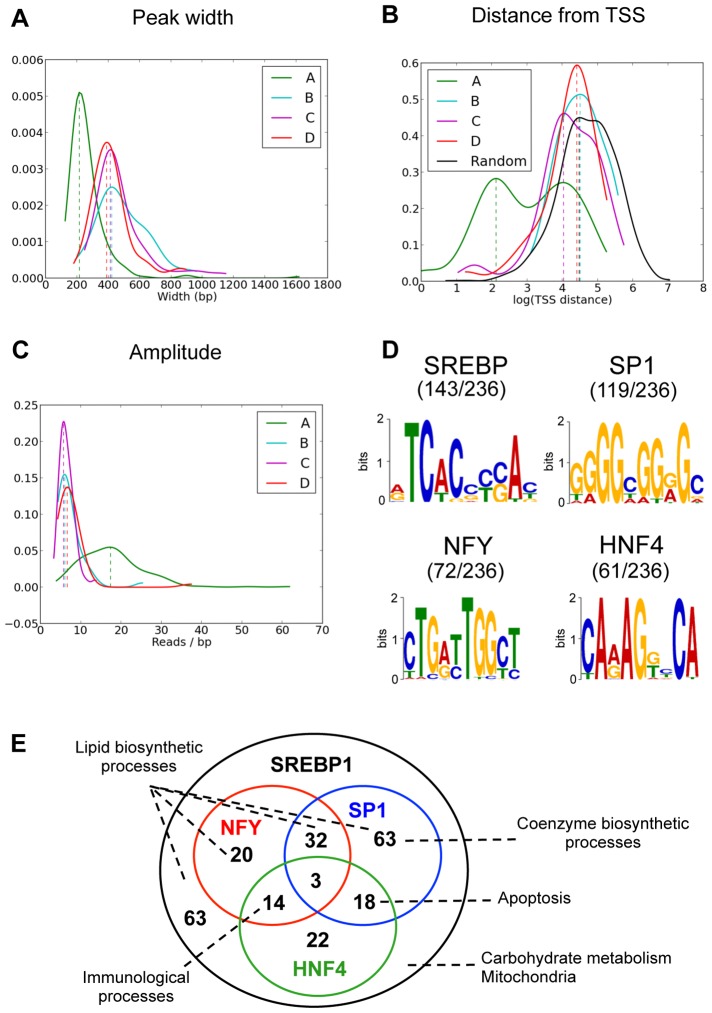
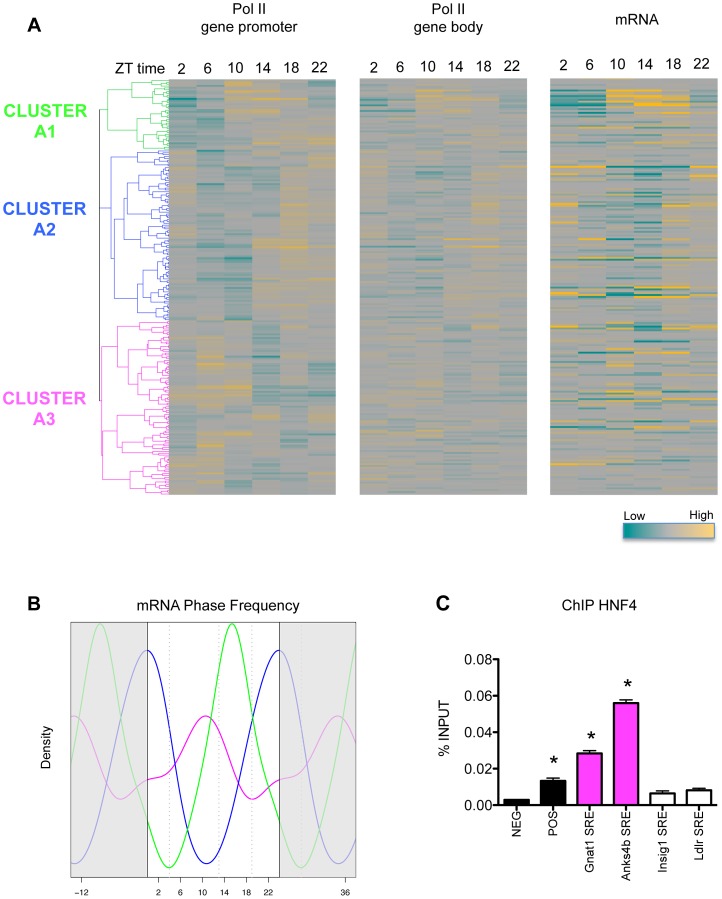
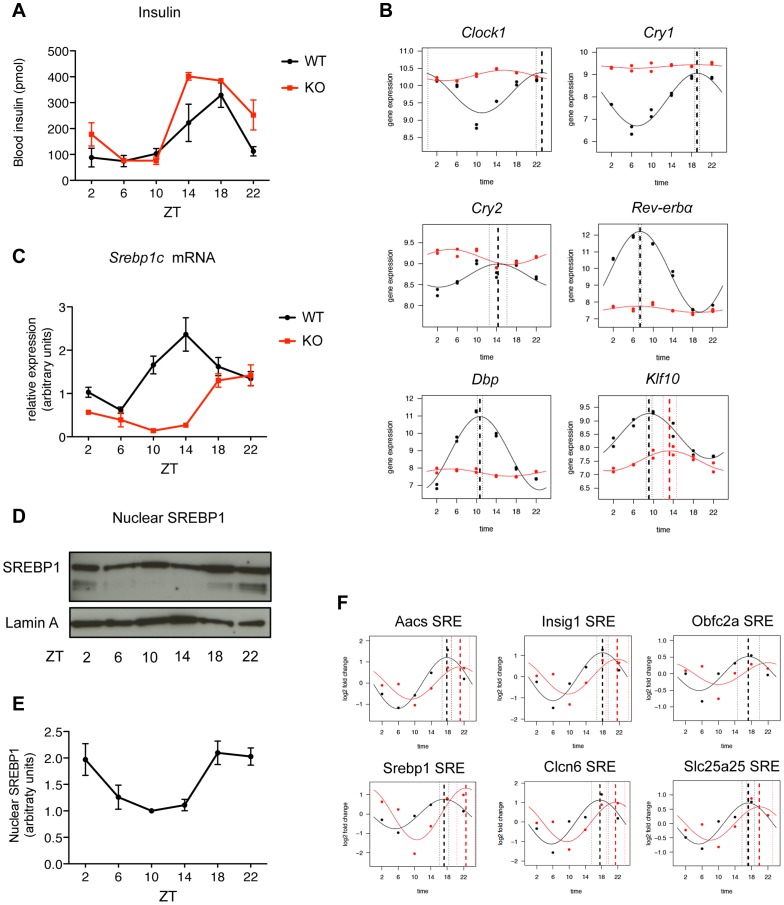
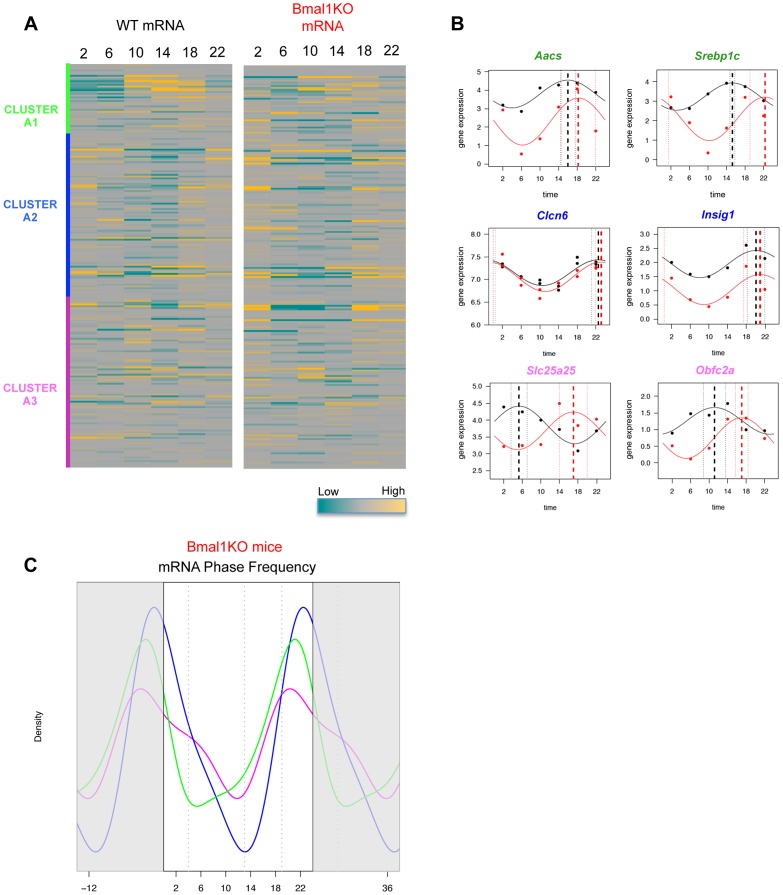
In mammals, the circadian clock allows them to anticipate and adapt physiology around the 24 hours. Conversely, metabolism and food consumption regulate the internal clock, pointing the existence of an intricate relationship between nutrient state and circadian homeostasis that is far from being understood. The Sterol Regulatory Element Binding Protein 1 (SREBP1) is a key regulator of lipid homeostasis. Hepatic SREBP1 function is influenced by the nutrient-response cycle, but also by the circadian machinery. To systematically understand how the interplay of circadian clock and nutrient-driven rhythm regulates SREBP1 activity, we evaluated the genome-wide binding of SREBP1 to its targets throughout the day in C57BL/6 mice. The recruitment of SREBP1 to the DNA showed a highly circadian behaviour, with a maximum during the fed status. However, the temporal expression of SREBP1 targets was not always synchronized with its binding pattern. In particular, different expression phases were observed for SREBP1 target genes depending on their function, suggesting the involvement of other transcription factors in their regulation. Binding sites for Hepatocyte Nuclear Factor 4 (HNF4) were specifically enriched in the close proximity of SREBP1 peaks of genes, whose expression was shifted by about 8 hours with respect to SREBP1 binding. Thus, the cross-talk between hepatic HNF4 and SREBP1 may underlie the expression timing of this subgroup of SREBP1 targets. Interestingly, the proper temporal expression profile of these genes was dramatically changed in Bmal1-/- mice upon time-restricted feeding, for which a rhythmic, but slightly delayed, binding of SREBP1 was maintained. Collectively, our results show that besides the nutrient-driven regulation of SREBP1 nuclear translocation, a second layer of modulation of SREBP1 transcriptional activity, strongly dependent from the circadian clock, exists. This system allows us to fine tune the expression timing of SREBP1 target genes, thus helping to temporally separate the different physiological processes in which these genes are involved.


Conflict of interest statement

The authors have declared that no competing interests exist.

Figures

Figure 1
Figure 1. Dynamics of SREBP1 binding.
(A) C57BL/6 mice were fed only during the night (ZT12-ZT24) for one week before collecting liver every 4 hours for one day. Chromatin from 5 mice was pooled at each time point and ChIP with an antibody against SREBP1 was performed. Peaks were positioned where the signal for SREBP1 was at least a four-fold in comparison to the input signal in at least one time point. The heat-map represents SREBP1 binding to all its targets along the time. Hierarchical clustering was done using Pearson correlation scores and identified four major clusters (A, B, C and D). The color scale is indicated below. In the column on the right, black lines indicate that Pol II was detected in the same site as SREBP1 in at least one time point, as assessed in our previous ChIP-seq data set . (B) Two SREBP1 binding sites were identified in the proximity of Srebp1 gene, at a distance of −30 and +299 nucleotides from the Srebp1c and Srebp1a TSS, respectively. Graphs represent the fitting to a cosine function of experimental data obtained on these peaks (black dots), in order to calculate the phase of the binding (dashed line), its interval of confidence (dotted lines) and the associated P-value. (C) Histogram of binding phase frequency in clusters A, B and C, for peaks with a P-value of the amplitude <0.1. None of the peaks belonging to cluster D met this requirement. (D) mRNA expression of Srebp1c was evaluated by qPCR in livers from C57BL/6 mice at the indicated ZT time (n = 5). Data are normalized using 36B4 as housekeeping gene. (E) Hepatic nuclear extracts from C57BL/6 mice were subjected to western blot analysis to detect the nuclear SREBP1. U2AF was used as loading control. Each sample is a pool of 5 livers. (F) Quantification of the Western Blot was performed by densitometry, using ImageJ software.
Figure 2
Figure 2. Features of SREBP1 binding sites.
(A) Distribution of peak lengths in the four clusters of SREBP1 binding sites shown in figure 1A. (B) Distribution of the distance from the closest annotated TSS of SREBP1 binding peaks belonging to the four clusters. Cluster A is enriched in sequences closer to a TSS, whereas the profile of cluster B, C and D is overlapping with that of 1000 randomly selected sequences (black line). (C) Distribution of the amplitudes of SREBP1 binding oscillation. (D) Overrepresented motifs within SREBP1 binding sites belonging to cluster A were found using MEME . DNA sequences in the window under each SREBP1 peak were used for the sequence analysis. (E) The 236 SREBP1 binding sites (distributed in 223 genes) belonging to cluster A were associated to the closest genes. Annotations are available for 219 of these 224 genes and the Venn diagram shows the overlap between the presence of SREBP1 and the presence of a nearby a binding site for SP1, NFY and/or HNF4. The most relevant functional pathways that were enriched in the different sets of target genes are indicated.
Figure 3
Figure 3. Pol II recruitment on SREBP1 target genes is not always synchronized with SREBP1 binding.
(A) The heat-maps represent the recruitment of Pol II to the promoter (left) and to the gene body (middle) of SREBP1 putative target genes along the day, as assessed in our previous ChIP-seq data set . In parallel, we evaluated hepatic gene expression by microarray analysis in the same samples (right). Hierarchical clustering was done applying a Pearson correlation scores to the data describing Pol II recruitment on the promoters of SREBP1 target genes (left). Three major clusters of genes displaying a different temporal binding profile of Pol II were identified (A1, A2, and A3). The genes are ordered in the three heat-maps according to this clustering. (B) Gene expression data from microarray analysis were fit to a cosine function to estimate the phase of expression (peak time of the fit) of SREBP1 target genes. The graph shows the smoothing of phase distributions of the genes belonging to the three clusters (green line for A1, blue line for A2, magenta line for A3). Only genes with a P-value<0.05 are plotted. Dotted lines define three time intervals containing the most recurrent phases associated to the genes belonging to the clusters A1, A2 and A3. (C) HNF4 binding was tested on randomly selected SRE identified in our SREBP1 ChIP-seq. Gnat1 and Anks4b SREs belong to cluster A3 and contain a HNF4 putative binding sites. In contrast, Ldlr and Insig1 SREs do not contain in their sequence a HNF4 motif and belong to cluster A2. NEG and POS were used as negative and positive control loci and correspond to two regions of Cyp7a1 promoter, localized at −1500 and −150 from the TSS, respectively . The graph shows the mean ± SEM of three independent experiments. * indicates P-value<0.01 vs. NEG. Statistical analysis was performed by one-way ANOVA followed by Bonferroni post-test. Primer sequences are listed in Table S8.
Figure 4
Figure 4. SREBP1 binding is rhythmic in Bmal1−/− upon time-restricted feeding.
(A) Bmal1−/− (red line) and control mice (black line) were fed only during the night for one week before the sacrifice. Plasma insulin levels were measured at the indicated time points (n = 3–6). (B) mRNA levels of key genes of the cellular molecular clock were measured by qPCR in Bmal1−/− and control mice (n = 5). (C) Hepatic expression of Srebp1c was evaluated by qPCR in Bmal1−/− and control mice (n = 5). Data are normalized using 36b4 and Rps9 as housekeeping genes. (D) Representative western blot analysis of the nuclear SREBP1 in hepatic nuclear extracts from Bmal1−/− mice. Lamin A was used as loading control. Each sample is a pool of 5 livers. (E) Western Blot quantification was performed by densitometry, using ImageJ software. Each point represents the mean ± SEM of the quantification of three analyses performed in three independent sets of Bmal1−/− mice (n≥3 per each time point). (F) ChIP of SREBP1 was performed in livers of Bmal1−/− and control mice at the indicated time points. SREBP1 binding was tested on 6 loci (SRE) identified by ChIP-seq in the proximity of the indicated genes. Aacs and Srebp1c belong to cluster A1, Insig1 and Clcn6 belong to cluster A2, whereas Obfc2a and Slc25a25 belong to cluster A3. Primer sequences used for qPCR analyses are available in Tables S7 and S8.
Figure 5
Figure 5. Phase of expression of rhythmic SREBP1 target genes is perturbed in Bmal1−/− upon time-restricted feeding.
(A) The heat-maps represent the hepatic gene expression of putative SREBP1 target genes in wild type (left) and Bmal1−/− mice (right), after one week of time-restricted feeding, as assessed by microarray analysis. The order of the genes is based on the clustering shown in figure 3 and is maintained in the two heat-maps. (B) Validation of hepatic mRNA level variation of a panel of the indicated SREBP1 putative target genes. (C) Gene expression data from microarray analysis in Bmal1−/− mice were fit to a cosine function to estimate the phase of expression (peak time of the fit) of SREBP1 target genes. The graph shows the smoothing of phase distributions of the genes belonging to the three clusters (green line for A1, blue line for A2, magenta line for A3). Only genes showing a P value<0.05 in Bmal1−/− mice are plotted.

References

    1. Moynihan Ramsey K, Marcheva B, Kohsaka A, Bass J (2007) The Clockwork of Metabolism. Annual Review of Nutrition 27: 219–240. - PubMed
    1. Stokkan K-A, Yamazaki S, Tei H, Sakaki Y, Menaker M (2001) Entrainment of the Circadian Clock in the Liver by Feeding. Science 291: 490–493. - PubMed
    1. Damiola F, Le Minh N, Preitner N, Kornmann B, Fleury-Olela F, et al. (2000) Restricted feeding uncouples circadian oscillators in peripheral tissues from the central pacemaker in the suprachiasmatic nucleus. Genes Dev 14: 2950–2961. - PMC - PubMed
    1. Vollmers C, Gill S, Di Tacchio L, Pulivarthy SR, Le HD, et al. (2009) Time of feeding and the intrinsic circadian clock drive rhythms in hepatic gene expression. Proceedings of the National Academy of Sciences 106 (50) 21453–8. - PMC - PubMed
    1. Di Lorenzo L, De Pergola G, Zocchetti C, L'abbate N, Basso A, et al. (2003) Effect of shift work on body mass index: results of a study performed in 319 glucose-tolerant men working in a Southern Italian industry. Int J Obes Relat Metab Disord 27: 1353–1358. - PubMed

Publication types

Substances

Associated data