. 2014 Mar 6;10(3):e1004226.
doi: 10.1371/journal.pgen.1004226. eCollection 2014 Mar.

The functional consequences of variation in transcription factor binding

Affiliations

The functional consequences of variation in transcription factor binding

Darren A Cusanovich et al. PLoS Genet. .

Abstract

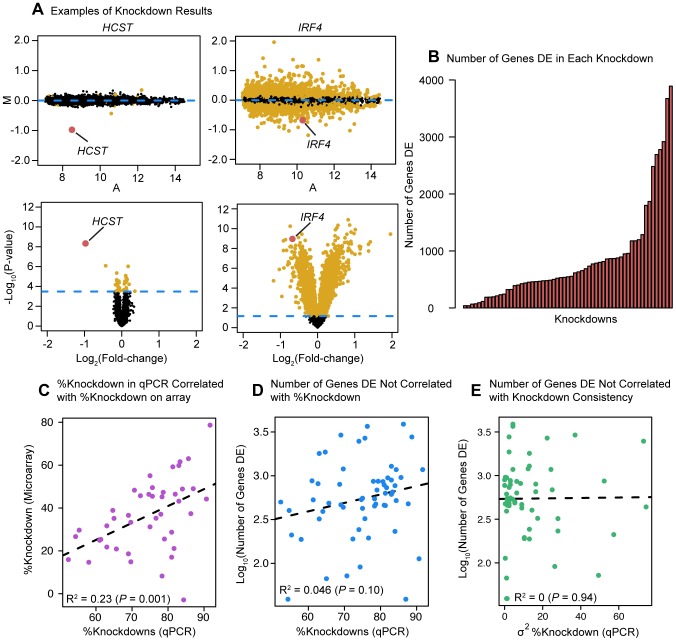
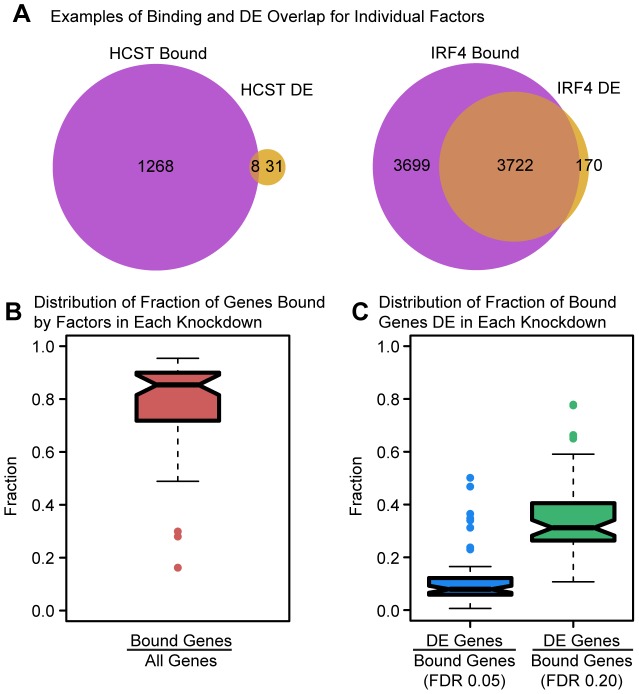
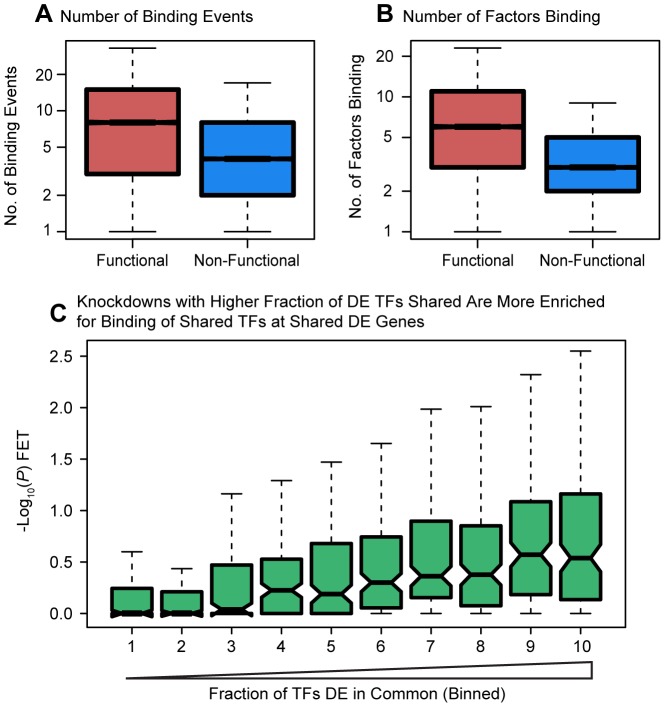
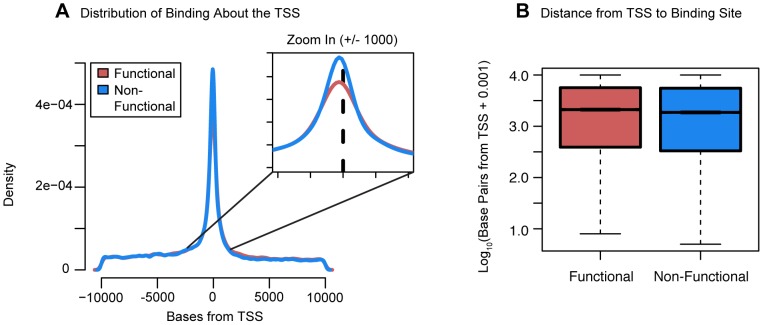
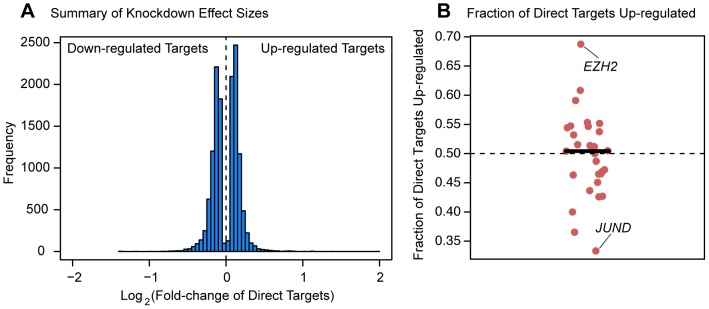
One goal of human genetics is to understand how the information for precise and dynamic gene expression programs is encoded in the genome. The interactions of transcription factors (TFs) with DNA regulatory elements clearly play an important role in determining gene expression outputs, yet the regulatory logic underlying functional transcription factor binding is poorly understood. Many studies have focused on characterizing the genomic locations of TF binding, yet it is unclear to what extent TF binding at any specific locus has functional consequences with respect to gene expression output. To evaluate the context of functional TF binding we knocked down 59 TFs and chromatin modifiers in one HapMap lymphoblastoid cell line. We then identified genes whose expression was affected by the knockdowns. We intersected the gene expression data with transcription factor binding data (based on ChIP-seq and DNase-seq) within 10 kb of the transcription start sites of expressed genes. This combination of data allowed us to infer functional TF binding. Using this approach, we found that only a small subset of genes bound by a factor were differentially expressed following the knockdown of that factor, suggesting that most interactions between TF and chromatin do not result in measurable changes in gene expression levels of putative target genes. We found that functional TF binding is enriched in regulatory elements that harbor a large number of TF binding sites, at sites with predicted higher binding affinity, and at sites that are enriched in genomic regions annotated as "active enhancers."


Conflict of interest statement

The authors have declared that no competing interests exist.

Figures

Figure 1
Figure 1. Differential expression analysis.
(a) Examples of differential expression analysis results for the genes HCST and IRF4. The top two panels are ‘MA plots’ of the mean Log2(expression level) between the knockdown arrays and the controls for each gene (x-axis) to the Log2(Fold-Change) between the knockdowns and controls (y-axis). Differentially expressed genes at an FDR of 5% are plotted in yellow (points 50% larger). The gene targeted by the siRNA is highlighted in red. The bottom two panels are ‘volcano plots’ of the Log2(Fold-Change) between the knockdowns and controls (x-axis) to the P-value for differential expression (y-axis). The dashed line marks the 5% FDR threshold. Differentially expressed genes at an FDR of 5% are plotted in yellow (points 50% larger). The red dot marks the gene targeted by the siRNA. (b) Barplot of number of differentially expressed genes in each knockdown experiment. (c) Comparison of the knockdown level measured by qPCR (RNA sample collected 48 hours post-transfection) and the knockdown level measured by microarray. (d) Comparison of the level of knockdown of the transcription factor at 48 hrs (evaluated by qPCR; x-axis) and the number of genes differentially expressed in the knockdown experiment (y-axis). (e) Comparison of the variance in knockdown efficiency between replicates for each transcription factor (evaluated by qPCR; x-axis) and the number of differentially expressed genes in the knockdown experiment (y-axis).
Figure 2
Figure 2. Effect sizes for differentially expressed genes.
Boxplots of absolute Log2(fold-change) between knockdown arrays and control arrays for all genes identified as differentially expressed in each experiment. Outliers are not plotted. The gray bar indicates the interquartile range across all genes differentially expressed in all knockdowns. Boxplots are ordered by the number of genes differentially expressed in each experiment. Outliers were not plotted.
Figure 3
Figure 3. Intersecting binding data and expression data for each knockdown.
(a) Example Venn diagrams showing the overlap of binding and differential expression for the knockdowns of HCST and IRF4 (the same genes as in Figure 1). (b) Boxplot summarizing the distribution of the fraction of all expressed genes that are bound by the targeted gene or downstream factors. (c) Boxplot summarizing the distribution of the fraction of bound genes that are classified as differentially expressed, using an FDR of either 5% or 20%.
Figure 4
Figure 4. Degree of binding correlated with function.
Boxplots comparing (a) the number of sites bound, and (b) the number of differentially expressed transcription factors binding events near functionally or non-functionally bound genes. We considered binding for siRNA-targeted factor and any factor differentially expressed in the knockdown. (c) Focusing only on genes differentially expressed in common between each pairwise set of knockdowns we tested for enrichments of functional binding (y-axis). Pairwise comparisons between knockdown experiments were binned by the fraction of differentially expressed transcription factors in common between the two experiments. For these boxplots, outliers were not plotted.
Figure 5
Figure 5. Distribution of functional binding about the TSS.
(a) A density plot of the distribution of bound sites within 10 kb of the TSS for both functional and non-functional genes. Inset is a zoom-in of the region +/−1 kb from the TSS (b) Boxplots comparing the distances from the TSS to the binding sites for functionally bound genes and non-functionally bound genes. For the boxplots, 0.001 was added before log10 transforming the distances and outliers were not plotted.
Figure 6
Figure 6. Magnitude and direction of differential expression after knockdown.
(a) Density plot of all Log2(fold-changes) between the knockdown arrays and controls for genes that are differentially expressed at 5% FDR in one of the knockdown experiments as well as bound by the targeted transcription factor. (b) Plot of the fraction of differentially expressed putative direct targets that were up-regulated in each of the knockdown experiments.

References

    1. Jolma A, Yan J, Whitington T, Toivonen J, Nitta KR, et al. (2013) DNA-binding specificities of human transcription factors. Cell 152: 327–339 doi:10.1016/j.cell.2012.12.009 - DOI - PubMed
    1. Nobrega MA, Ovcharenko I, Afzal V, Rubin EM (2003) Scanning human gene deserts for long-range enhancers. Science 302: 413 doi:10.1126/science.1088328 - DOI - PubMed
    1. Bernstein BE, Birney E, Dunham I, Green ED, Gunter C, et al. (2012) An integrated encyclopedia of DNA elements in the human genome. Nature 489: 57–74 doi:10.1038/nature11247 - DOI - PMC - PubMed
    1. Pique-Regi R, Degner JF, Pai AA, Gaffney DJ, Gilad Y, et al. (2011) Accurate inference of transcription factor binding from DNA sequence and chromatin accessibility data. Genome Res 21: 447–455 doi:10.1101/gr.112623.110 - DOI - PMC - PubMed
    1. Song L, Crawford GE (2010) DNase-seq: a high-resolution technique for mapping active gene regulatory elements across the genome from mammalian cells. Cold Spring Harb Protoc 2010: pdb.prot5384 doi:10.1101/pdb.prot5384 - DOI - PMC - PubMed

Publication types