

Gut microbiota signatures predict host and microbiota responses to dietary interventions in obese individuals
- PMID: 24603757
- PMCID: PMC3946202
- DOI: 10.1371/journal.pone.0090702
Gut microbiota signatures predict host and microbiota responses to dietary interventions in obese individuals
Abstract
Background: Interactions between the diet and intestinal microbiota play a role in health and disease, including obesity and related metabolic complications. There is great interest to use dietary means to manipulate the microbiota to promote health. Currently, the impact of dietary change on the microbiota and the host metabolism is poorly predictable and highly individual. We propose that the responsiveness of the gut microbiota may depend on its composition, and associate with metabolic changes in the host.
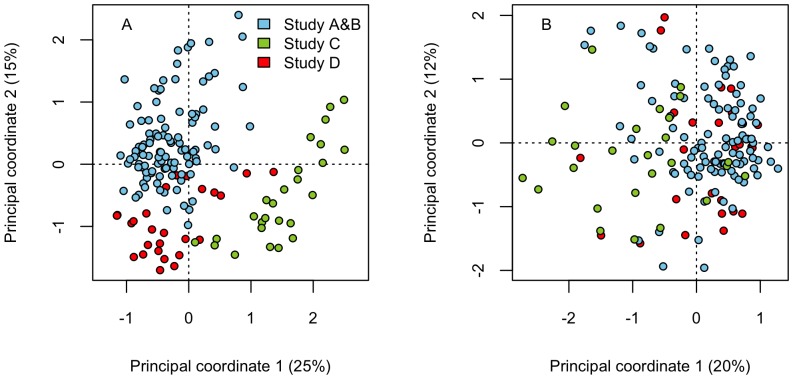
Methodology: Our study involved three independent cohorts of obese adults (n = 78) from Belgium, Finland, and Britain, participating in different dietary interventions aiming to improve metabolic health. We used a phylogenetic microarray for comprehensive fecal microbiota analysis at baseline and after the intervention. Blood cholesterol, insulin and inflammation markers were analyzed as indicators of host response. The data were divided into four training set - test set pairs; each intervention acted both as a part of a training set and as an independent test set. We used linear models to predict the responsiveness of the microbiota and the host, and logistic regression to predict responder vs. non-responder status, or increase vs. decrease of the health parameters.
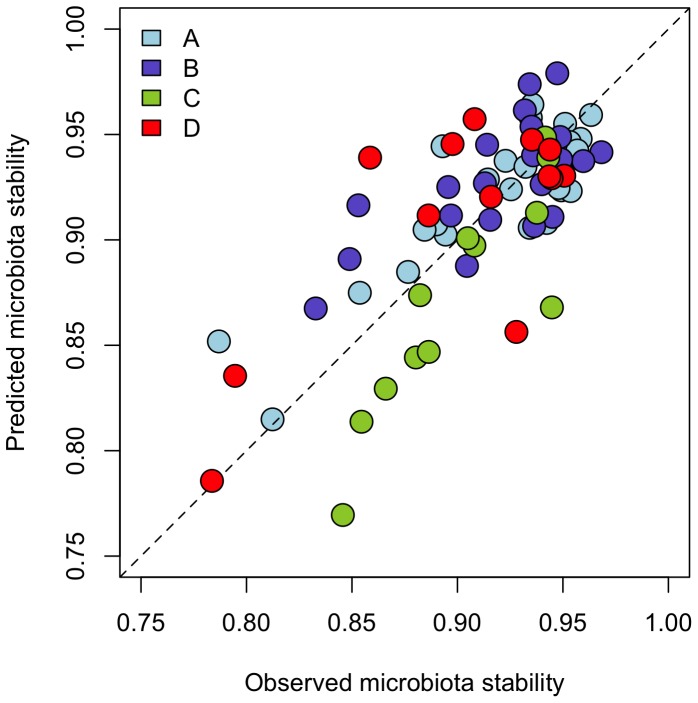
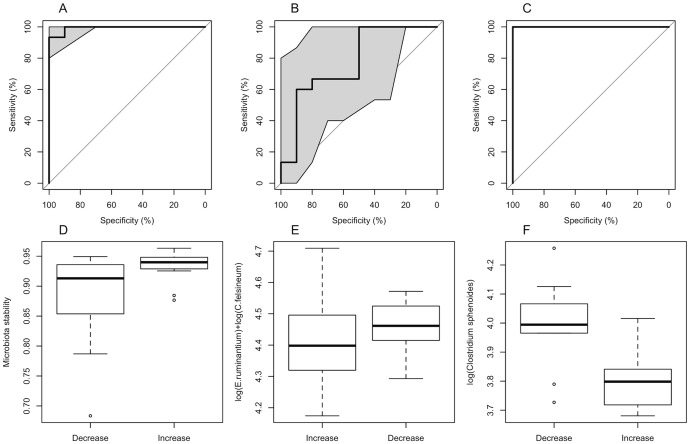
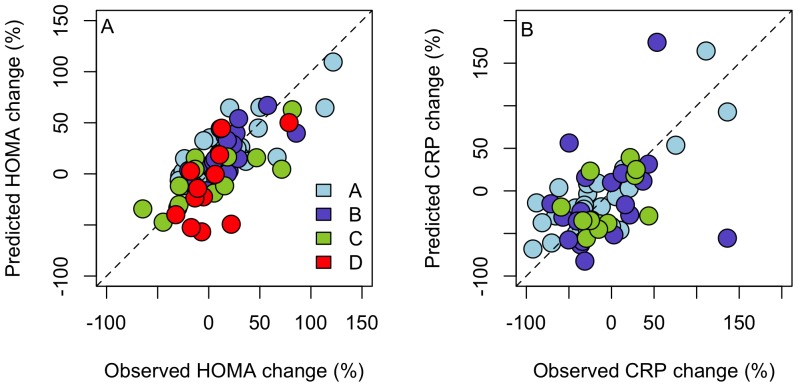
Principal findings: Our models, based on the abundance of several, mainly Firmicute species at baseline, predicted the responsiveness of the microbiota (AUC = 0.77-1; predicted vs. observed correlation = 0.67-0.88). Many of the predictive taxa showed a non-linear relationship with the responsiveness. The microbiota response associated with the change in serum cholesterol levels with an AUC of 0.96, highlighting the involvement of the intestinal microbiota in metabolic health.
Conclusion: This proof-of-principle study introduces the first potential microbial biomarkers for dietary responsiveness in obese individuals with impaired metabolic health, and reveals the potential of microbiota signatures for personalized nutrition.
Conflict of interest statement
Figures
References
-
- Bäckhed F (2012) Host responses to the human microbiome. Nutr Rev 70: S14–S17. - PubMed
-
- Holmes E, Kinross J, Gibson GR, Burcelin R, Jia W, et al. (2012) Therapeutic modulation of microbiota-host metabolic interactions. Science Translational Medicine 4: 137rv6. - PubMed
-
- Million M, Lagier J, Yahav D, Paul M (2013) Gut bacterial microbiota and obesity. Clinical Microbiology and Infection 19: 305–313. - PubMed
-
- Everard A, Cani PD (2013) Diabetes, obesity and gut microbiota. Best Practice & Research Clinical Gastroenterology 27: 73–83. - PubMed
-
- Flint HJ (2011) Obesity and the gut microbiota. J Clin Gastroenterol 45: S128–S132. - PubMed
Publication types
MeSH terms
Substances
LinkOut - more resources
Full Text Sources
Other Literature Sources
Medical
