. 2014 Mar 7;343(6175):1246949.
doi: 10.1126/science.1246949.

Innate immune activity conditions the effect of regulatory variants upon monocyte gene expression

Affiliations

Innate immune activity conditions the effect of regulatory variants upon monocyte gene expression

Benjamin P Fairfax et al. Science. .

Abstract

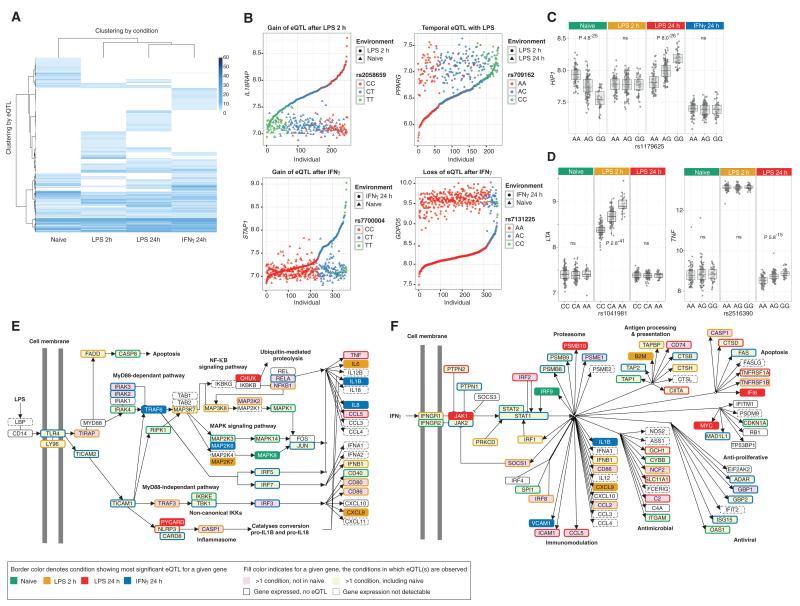
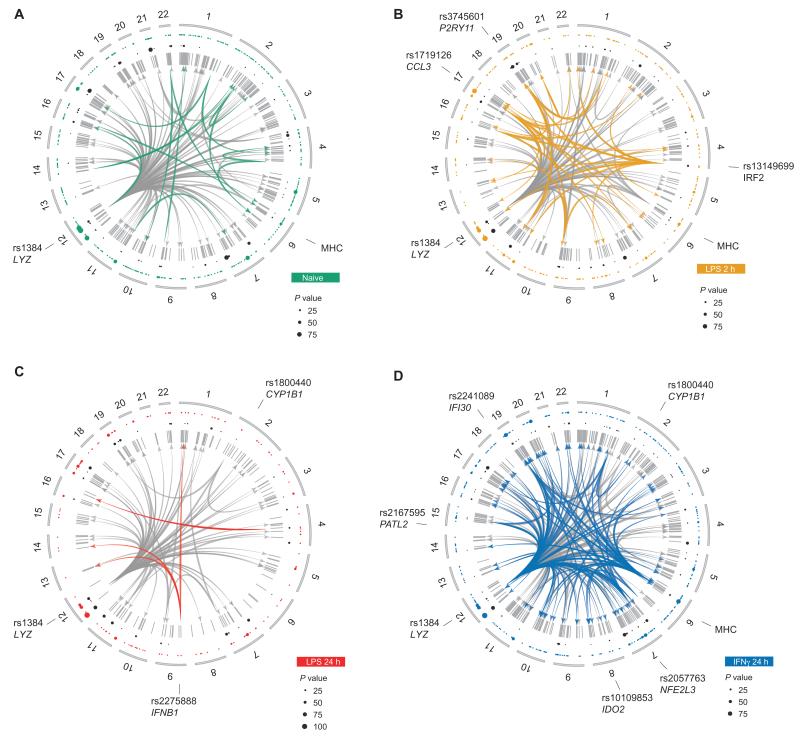
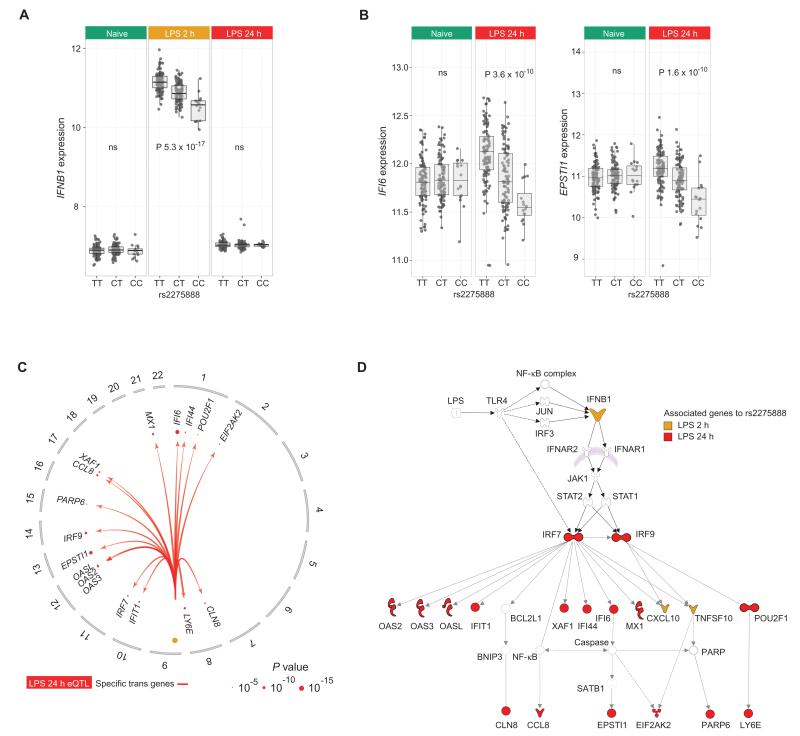
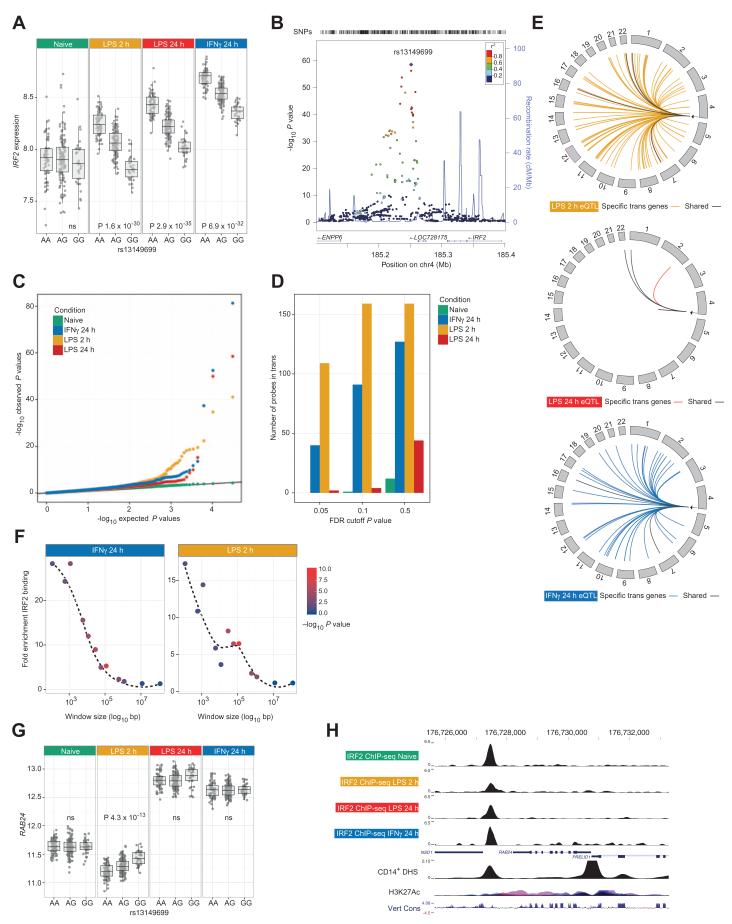
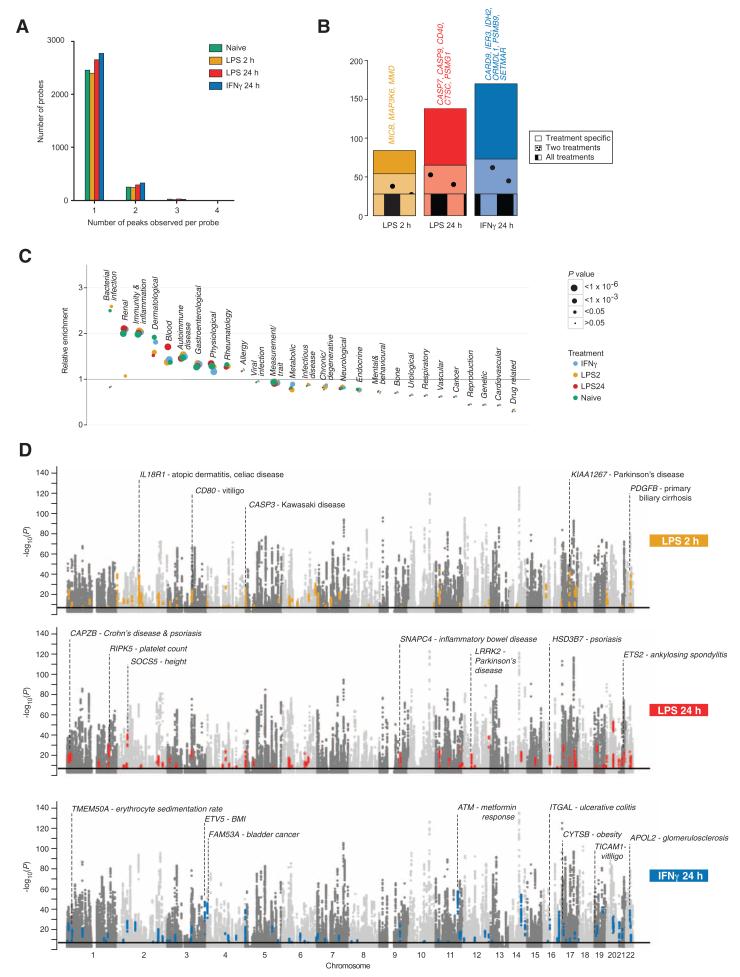
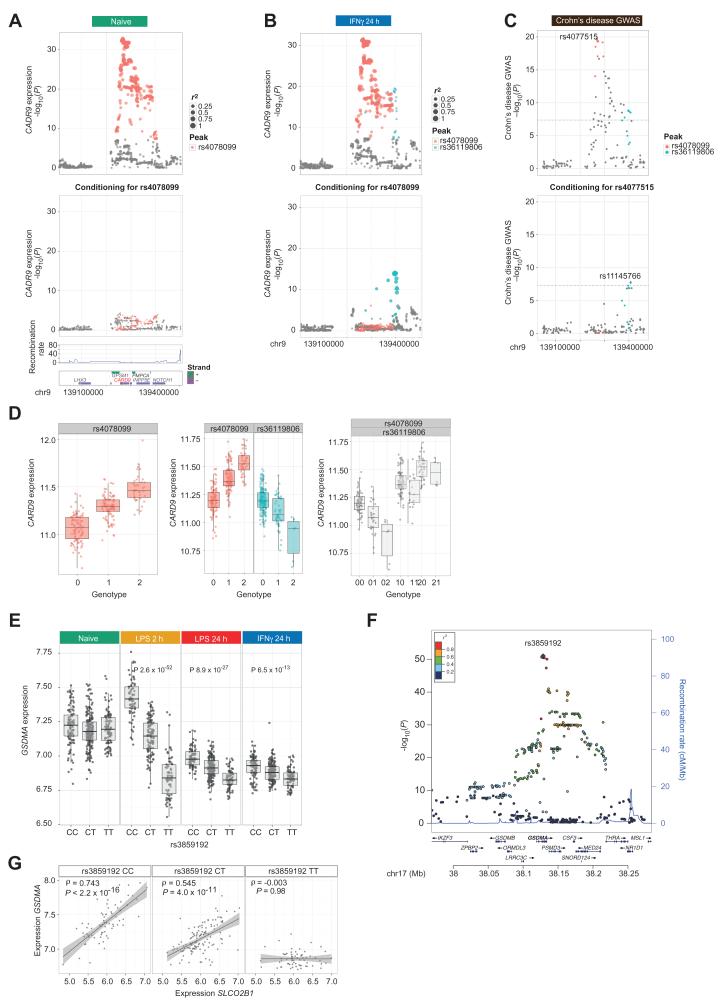
To systematically investigate the impact of immune stimulation upon regulatory variant activity, we exposed primary monocytes from 432 healthy Europeans to interferon-γ (IFN-γ) or differing durations of lipopolysaccharide and mapped expression quantitative trait loci (eQTLs). More than half of cis-eQTLs identified, involving hundreds of genes and associated pathways, are detected specifically in stimulated monocytes. Induced innate immune activity reveals multiple master regulatory trans-eQTLs including the major histocompatibility complex (MHC), coding variants altering enzyme and receptor function, an IFN-β cytokine network showing temporal specificity, and an interferon regulatory factor 2 (IRF2) transcription factor-modulated network. Induced eQTL are significantly enriched for genome-wide association study loci, identifying context-specific associations to putative causal genes including CARD9, ATM, and IRF8. Thus, applying pathophysiologically relevant immune stimuli assists resolution of functional genetic variants.


Figures

Fig. 1
Fig. 1. Genotype modulates the gene expression response to innate immune stimuli in monocytes
(A) Cis-eQTL mapping of 228 individuals with matched expression data available across all four treatments shows that the majority of eQTL are context-dependent. Genes with significant eQTL (FDR < 0.05) are hierarchically clustered along the y axis according to the t statistic of the most significant eQTL present across treatments (along the x axis). (B) Gene expression values before and after treatment plotted pairwise by individual. In clockwise order: 2-hour LPS induces differential expression of IL18RAP dependent on rs2058659 genotype; 2-hour LPS treatment results in uniform PPARG up-regulation, whereas continued LPS exposure over 24 hours is associated with reduction in expression in carriers of the A allele of rs709162; an eQTL tagged by rs7131225 found in untreated cells (naïve state) for GDPD5 transcription could not be detected after gene induction with IFN-γ; and IFN-γ stimulation leads to induction of STAP1 expression in carriers of the T allele of rs7700004, relative to the C allele. (C) Cis-eQTL displays context-specific directional effects. rs1179625 is the SNP with the greatest effect on expression of HIP1 in the naïve state and after 24-hour LPS but exhibits opposing direction of effect. ns, not significant. (D) Induction by LPS reveals stimulus-specific cis-eQTL for LTA and TNF. (E and F) Genes within the (E) TLR4 signaling and (F) IFN-γ signaling pathways highlighted for those with eQTL for shared data set illustrating context specificity.
Fig. 2
Fig. 2. Trans-eQTL demonstrate context specificity and identify master regulatory loci after treatment
(A to D) Circular plots demonstrating chromosomal location of trans-acting eQTL of naïve (A), 2-hour LPS treatment (B), 24-hour LPS treatment (C), and IFN treatment (D). From outside to inside: examples of major trans hubs are indicated by rs number of lead eSNP and for that eSNP the name of any cis gene, the nearest gene or genomic region; chromosome number; colored dots are significant trans-eQTL (color denotes treatment, size relative −log10 P value as per legend); black dots are significant cis-eQTL to the same SNP in these treatments, possibly identifying driver genes; gray lines indicate probes significantly regulated in trans; innermost joining lines illustrate start and end points of multiloci trans-eQTL (unique to a treatment by colored lines, observed in a minimum of two data sets by gray lines)—only multiloci eQTL mapping to more than one probe with an FDR <0.05 in the shared data set (n = 228) are illustrated.
Fig. 3
Fig. 3. Temporal effects for a stimulus-specific trans-eQTL
(A) A stimulus-specific local cis-acting eQTL for IFNB1 in monocytes after 2-hour LPS treatment tagged by rs2275888, which is in complete linkage disequilibrium (LD) (r2 = 1) with 15 other SNPs located ~60 kb telomeric to IFNB1 within the intronic sequence of PTPLAD2. (B) rs2275888 is significantly associated in trans with expression of known interferon-induced genes including IFI6 and ESTI1 only after 24-hour LPS. (C) Single SNP analysis at rs2275888 to resolve further genes in trans defined 17 genes showing significant trans association (FDR < 0.05) to rs2275888 after 24-hour LPS stimulation as illustrated in this circular plot. (D) IPA network analysis of trans-associated genes after LPS induction revealed a major network containing 19 genes (P = 1 × 10−44) based on the fit of the trans genes and biological functions. The IFNβ signaling cascade is shown with trans-associated genes to rs2275888 highlighted supporting the associations arising through cis-eQTL–driven differential expression of IFNB1.
Fig. 4
Fig. 4. Cis regulation of IRF2 at rs13149699 has profound transcriptional consequences in trans
(A) A significant cis-eQTL to the transcription factor IRF2 seen only after treatment (P values shown for shared data set; in the full data sets, PLPS2 = 2.1 × 10⁻³⁵, PLPS24 = 6.4 × 10−55 , PIFNγ = 2.6 × 10−59, and Pnaïve = ns). (B) Local association plot for 367 individuals after IFN-γ treatment including imputed genotypes. The peak eQTL for IRF2 remains rs13149699, 57-kb 3′ to the gene. (C) eQTL analysis was performed on rs13149699 alone in the shared (n = 228) data set to identify associated genes missed due to correction for multiple testing across all SNPs—qq plots demonstrating number of probes with expression associated with rs13149699 across treatments. Treatment results in significant numbers of probes deviating from expected, with greatest deviation after 2-hour LPS. (D) Bar charts demonstrating number of significantly associated probes at different FDR thresholds. Note relative absence of associations in untreated state despite the same number of tests being performed. (E) Circular plots demonstrating location of transeQTL (FDR < 0.05) after analysis on rs13149699 in the complete data sets. (F) Windows flanking probes tested for eQTL were defined, and the number of IRF2 ChIP-seq binding sites per treatment was counted. Probes in trans to rs13149699 were significantly enriched for IRF2 binding in both treatments (Fisher’s exact test). (G) Box plot showing allelic expression of RAB24 by rs13149699. (H) ChIP-seq for IRF2 from primary monocytes for different treatments illustrating differential binding 0.5-kb 3′ to RAB24. Also shown are ENCODE tracks for CD14+ DNase I hypersensitivity, H3K27Ac (seven cell lines), and vertebrate conservation (Multiz Alignment & Conservation 100 Species).
Fig. 5
Fig. 5. Stimulus-specific eQTL and GWAS
(A) Independent associations to the same probe within and between treatments were defined. The frequency distribution of the number of peaks observed per probe is shown by condition. (B) For genes showing an eQTL in naïve cells, the number of such genes with an additional stimulus-specific eQTL is shown according to stimulus and whether the eQTL were specific to that treatment or observed with two or all stimuli. Examples of immune relevant genes with second eQTL specific to a given stimulus are listed. (C) Enrichment analysis of treatment-specific eQTL by GWAS ontology category. (D) Manhattan plots demonstrating eQTL present in denoted treatment. Colored points correspond to eQTL where the primary peak is either a GWAS-identified locus or in r2 > 0.8 with a GWAS locus found in treated, but not naïve, monocytes.
Fig. 6
Fig. 6. Examples of context-specific eQTL informative for disease risk
(A) Local association plot showing evidence of cis-eQTL for CARD9 in naïve cells. After conditioning for rs4078099, no evidence of association is seen. (B) After induction with IFNγ, in addition to the eQTL tagged by rs4078099, a second stimulus-specific independent peak of association is tagged by rs36119806. (C) Local association plots for CD with SNPs colored as per (A) and (B). The lead SNP rs40771515 is in high LD with rs4078099 (r2 = 0.93); after conditioning, a second independent GWAS peak is seen (lead SNP rs11145766, r2 = 0.84 with rs136119806). (D) Box plots showing expression of CARD9 by allele in naïve cells, and after IFNγ stimulation, showing allelic association by SNP corrected for the effect of the other eQTL or by combination of inherited alleles for rs4078099 and rs36119806. (E) rs3859192 is the peak eQTL for expression of GSDMA, a transforming growth factor–β–regulated proapoptotic gene. (F) Local association plot for GSDMA expression after 2-hour LPS using imputed genotyping. (G) Allele-specific correlation for expression values per genotype demonstrates significant regulation of GSDMA expression in homozygous carriers of the C allele by the solute transporter SLCO2B1 after 2-hour LPS with no association being present in homozygous carriers of the T allele. Similar results were obtained analyzing monocytes after 24-hour LPS, and with both probes to SLCO2B1, with no association observed in the naïve state.

Comment in

References

    1. Parkes M, Cortes A, van Heel DA, Brown MA. Genetic insights into common pathways and complex relationships among immune-mediated diseases. Nat. Rev. Genet. 2013;14:661–673. doi: 10.1038/nrg3502. - PubMed
    1. Maurano MT, et al. Systematic localization of common disease-associated variation in regulatory DNA. Science. 2012;337:1190–1195. doi: 10.1126/science.1222794. - PMC - PubMed
    1. Nica AC, et al. Candidate causal regulatory effects by integration of expression QTLs with complex trait genetic associations. PLOS Genet. 2010;6:e1000895. doi: 10.1371/journal.pgen.1000895. - PMC - PubMed
    1. Emilsson V, et al. Genetics of gene expression and its effect on disease. Nature. 2008;452:423–428. doi: 10.1038/nature06758. - PubMed
    1. Moffatt MF, et al. Genetic variants regulating ORMDL3 expression contribute to the risk of childhood asthma. Nature. 2007;448:470–473. doi: 10.1038/nature06014. - PubMed

Publication types

MeSH terms