. 2014 Mar 7;343(6175):1246980.
doi: 10.1126/science.1246980.

Common genetic variants modulate pathogen-sensing responses in human dendritic cells

Affiliations

Common genetic variants modulate pathogen-sensing responses in human dendritic cells

Mark N Lee et al. Science. .

Abstract

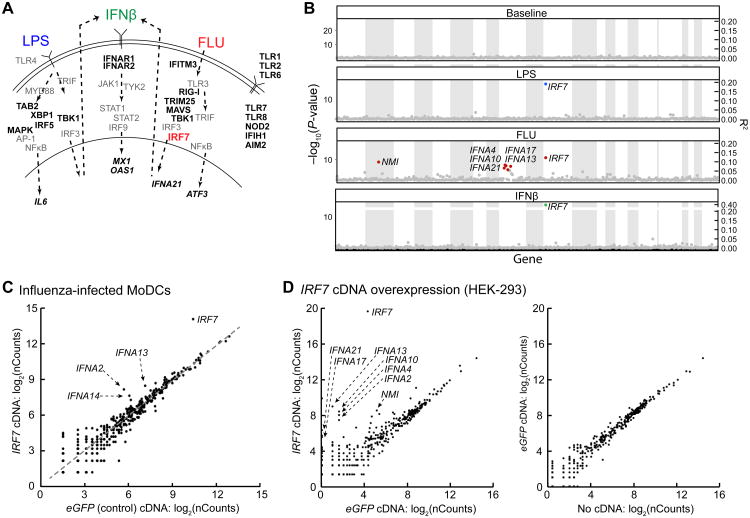
Little is known about how human genetic variation affects the responses to environmental stimuli in the context of complex diseases. Experimental and computational approaches were applied to determine the effects of genetic variation on the induction of pathogen-responsive genes in human dendritic cells. We identified 121 common genetic variants associated in cis with variation in expression responses to Escherichia coli lipopolysaccharide, influenza, or interferon-β (IFN-β). We localized and validated causal variants to binding sites of pathogen-activated STAT (signal transducer and activator of transcription) and IRF (IFN-regulatory factor) transcription factors. We also identified a common variant in IRF7 that is associated in trans with type I IFN induction in response to influenza infection. Our results reveal common alleles that explain interindividual variation in pathogen sensing and provide functional annotation for genetic variants that alter susceptibility to inflammatory diseases.


Figures

Fig. 1
Fig. 1. A strategy to identify gene-by-environment interactions in the innate immune responses of primary human dendritic cells
(A) Strategy used to identify baseline and response expression quantitative trait loci (eQTLs and reQTLs), consisting of five steps: (i) high-throughput isolation and stimulation of primary human MoDCs from 560 healthy individuals (dotted slices, male; solid-colored slices, female) collected as part of the PhenoGenetic cohort; (ii) whole-genome gene expression measurements in a subset of the cohort; (iii) selection of signature gene set, consisting of regulators and regulated genes; (iv) digital multiplex gene expression measurements of signature genes in the entire cohort; and (v) mapping of genetic variation to expression variation. GM-CSF, granulocyte-macrophage colony-stimulating factor; IL-4, interleukin-4. (B) Model of innate immune pathways activated by three stimuli demonstrating their downstream relationships. Lipopolysaccharide (“LPS”) from E. coli engages the TLR4 receptor; interferon-beta (“IFNβ”) engages the heterodimeric IFNAR receptor; influenza A/PR8 (ΔNS1) (“FLU”) engages the cytoplasmic TLR3 and RIG-I receptors. Receptor engagement activates signal transduction cascades that regulate expression of inflammatory genes, IFNs and IFN-stimulated genes. IFNAR activation also occurs during LPS and FLU stimulations because LPS and FLU both induce IFN production, leading to activation of ISREs. JAK1, Janus kinase 1.
Fig. 2
Fig. 2. Genome-wide expression profiles in MoDCs reveal response phenotypes
(A) Coefficient of variation (CV) of gene expression between 30 different donors (“Inter-individual CV”) plotted against CV of expression within 12 serial replicate samples (“Intra-individual CV”) for each differentially regulated (fold change >0.75 or <–1.5) gene following LPS or FLU stimulation. Yellow (up-regulated) and purple (down-regulated) circles represent genes with significant (moderated t test, FDR < 0.1) inter- vs. intra-individual variation. Right, log2(expression, microarray data) of CLEC4F in baseline, LPS-stimulated and FLU-infected MoDCs from 30 donors and 12 replicates, demonstrating example of a gene that shows significant (FDR < 0.01) inter- vs. intra-individual variation following LPS and FLU stimulations but not at baseline (fig. S2B). Standard error of replicate samples (n = 12) is shown for each sample. (B) Pie chart of 415 signature genes selected for Nanostring codeset: 222 (49%) are regulated genes that showed significant (mixed model variance components test, permutation FDR < 0.1) inter- vs. intra-individual variability; 61 (14%) are curated, regulated genes with a known function in the innate immune response; 76 (17%) are curated regulators in the TLR4, TLR3, RIG-I and IFNAR pathways; 41 (9%) are control genes including low-variance genes, sex-specific genes and non-expressed genes; 28 (6%) are regulated genes that were reported in the regions of autoimmune and infectious disease GWAS; and 21 (5%) are regulated genes that showed significant inter- versus intra-population variability. (C) Gene expression heatmap of the 415-gene signature in MoDCs from the microarray study (30 individuals) and the Nanostring study (534 individuals). Each row represents a gene; each column represents a donor sample at baseline, stimulated with LPS, infected with FLU or stimulated with IFNβ. Rows were clustered by k-means clustering of Nanostring dataset with major clusters (I, II, IIIa, IIIb and IV) labeled. Between the two heat maps, each row was labeled with colored dashes corresponding to one of the 6 categories described in (B).
Fig. 3
Fig. 3. Association analysis reveals cis-eQTLs and cis-reQTLs
(A and B) Manhattan plot of cis-eQTLs (A, baseline expression) and cis-reQTLs (B, LPS-, FLU- and IFNβ–stimulated fold changes relative to baseline) showing −log10(P values) (left y axis) and R2 values (right y-axis) for all cis-SNPs, which are displayed on the x-axis with associated genes ordered by their chromosomal location. (C) Box-whisker plots showing expression (left; log2(nCounts), y-axis) or fold change (right; log2(fold), y-axis) of DCBLD1, IFNA21, TEC and ARL5B in resting, LPS-stimulated, FLU-infected and IFNβ–stimulated MoDCs as a function of genotype of the respective cis-SNPs (x-axis: rs27434, rs10964871, rs10938526 and rs11015435). African Americans, Asians and Europeans in this order are displayed as separate box-whisker plots adjacent to each other in each condition. −Log10(P values) and β statistics are displayed in top right corners. (D and E) Allelic imbalance analysis of SLFN5 (D) and CLEC4F (E) in resting, LPS-stimulated, FLU-infected and IFNβ–stimulated MoDCs, showing the ratio of gene expression between the major and minor alleles in heterozygote (rs11651240 for SLFN5, rs2075221 for CLEC4F) cDNA samples (n = 8 in (D); n= 9 in (E)) normalized to the ratio in the corresponding genomic DNA samples; significant deviation from 1.0 (dashed line) is consistent with allelic imbalance. Data are from one experiment representative of three (mean and standard deviation shown). *P< 0.01, **P< 0.001, compared to unstimulated cells (Student's t-test). On the right panels, box-whisker plots showing expression (left; log2(nCounts), y-axis) or fold change (right; log2(fold), y-axis) of SLFN5 (D) and CLEC4F (E) in resting, LPS-stimulated, FLU-infected and IFNβ–stimulated MoDCs as a function of genotype of the respective cis-SNPs: rs11867191 and rs2075221. (F) Schematic showing the different combinations of stimuli leading to significant cis-reQTLs, with the most significant examples listed. Specificity to conditions was defined with M-value >0.9 taken as the inclusion criteria and M-value <0.1 taken as the exclusion criteria for each condition.
Fig. 4
Fig. 4. Functional fine-mapping and mechanism of cis-reQTLs
(A) Pathway diagram of signal transduction cascade downstream of IFNAR activation. Activation of receptor leads to downstream activation of JAK-STAT cascade, leading to posttranslational activation of STAT and IRF transcription factors. (B) LocusZoom plots showing the −log10(P-values) of imputed cis-eQTLs (y-axis) in the chromosomal regions (x axis) of SLFN5, CLEC4F and ARL5B. The most significant imputed SNPs in each locus are labeled. (C) Schematic representation of alleles in the regions near the SLFN5, CLEC4F and ARL5B genes that are in STAT2 ChIP-Seq binding sites or that perturb ISRE motifs (SNPs are shown as vertical bars and in red letters). (D) Elecrophoretic mobility shift assays (EMSA) with 24- to 26-bpradiolabeleddsDNA probes—containing a known ISRE motif control, a mutated ISRE motif control, the CLEC4F rs35856355 major (C) or minor allele (A) sequences, or the ARL5B rs2130531 major (G) or minor allele (A) sequences—incubated with nuclear lysates from IFNβ–stimulated MoDCs. On the right, supershift assays with or without antibodies against IRF1, IRF9, and STAT2 (designated α-IRF-1, and so on) with the CLEC4F rs35856355 major (C) probe are shown. (E) Luciferase expression from reporter constructs transfected into HEK293 cells that were left unstimulated or were stimulated with 1000 U/mLIFNβ for 21 h. 150–200 bp sequences from the major and minor haplotypes of the SLFN5, CLEC4F and ARL5B regions were subcloned 5′ of a minimal promoter and firefly luciferase gene. Firefly luciferase expression was normalized to Renilla luciferase expression expressed from cotransfected plasmid. (F) Fold change log2(IFNβstim/unstim) of signature genes in wild-type HEK-293 cells (rs11080327A/G), plotted against fold change in CRISPR-converted (rs11080327G/G) HEK-293 cells. Data are from one experiment representative of three (mean and standard shown in (E)). *P< 0.05, **P< 0.01, compared to unstimulated cells (Student's t-test).
Fig. 5
Fig. 5. Trans-reQTL association at the IRF7 cis-regulatory locus
(A) Diagram showing selected components of TLR4, TLR3, RIG-I and IFNAR pathways. Components with significant cis-eQTLs (permutation FDR < 0.05) are shown in black (or red if they also have a trans-eQTL); components that do not have significant cis-eQTLs are shown in grey. (B) Manhattan plot showing the trans-association of rs12805435 to all 415 genes on signature gene set in baseline, LPS-stimulated, FLU-infected and IFNβ–stimulated conditions. Trans-reQTL to NMI and cluster of IFNα genes (IFNA4, IFNA10, IFNA13, IFNA17 and IFNA21) are labeled. (C) Expression (log2(nCounts)) of 415 signature genes in FLU-infected MoDCs overexpressing IRF7, plotted against expression in FLU-infected MoDCs overexpressing eGFP control. (D) Expression (log2(nCounts)) of 415 signature genes in HEK-293 cells overexpressing IRF7, plotted against expression in HEK-293 cells overexpressing eGFP control. Right, expression of genes in cells with eGFP overexpression vs. cells without cDNA.
Fig. 6
Fig. 6. Autoimmune and infectious disease–associated SNPs are cis-eQTLs and cis-reQTLs
(A) Expression (log2(nCounts)) of NOD2 in resting and IFNβ–stimulated MoDCs from 184 Caucasians as a function of genotype of the leprosy GWAS SNP, rs9302752 (left). Right, expression (log2(nCounts)) of IRF7 in resting and IFNβ–stimulated MoDCs from 184 Caucasians as a function of genotype of the SLE GWAS SNP, rs4963128. (B) Plot showing overlap of genome-wide significant (P< 5×10⁻⁸) GWAS SNPs with cis-eQTLs and reQTLs in MoDCs, with clinical phenotypes connected to corresponding gene expression phenotypes by lines. Orange circles represent cis-reQTLs (P< 10−7); yellow circles represent stimulus-specific cis-eQTLs (P< 10−7).

Comment in

Similar articles

Cited by

References

    1. Civelek M, Lusis AJ. Systems genetics approaches to understand complex traits. Nature reviews Genetics. 2013 Dec 3; - PMC - PubMed
    1. Thomas D. Gene--environment-wide association studies: emerging approaches. Nature reviews Genetics. 2010 Apr;11:259. - PMC - PubMed
    1. Eichler EE, et al. Missing heritability and strategies for finding the underlying causes of complex disease. Nature reviews Genetics. 2010 Jun;11:446. - PMC - PubMed
    1. Stranger BE, et al. Population genomics of human gene expression. Nature genetics. 2007 Oct;39:1217. - PMC - PubMed
    1. Schadt EE, et al. Genetics of gene expression surveyed in maize, mouse and man. Nature. 2003 Mar 20;422:297. - PubMed

Publication types

MeSH terms

Associated data