

Sensitivity to self-administered cocaine within the lateral preoptic-rostral lateral hypothalamic continuum
- PMID: 24604249
- PMCID: PMC4157119
- DOI: 10.1007/s00429-014-0736-6
Sensitivity to self-administered cocaine within the lateral preoptic-rostral lateral hypothalamic continuum
Abstract
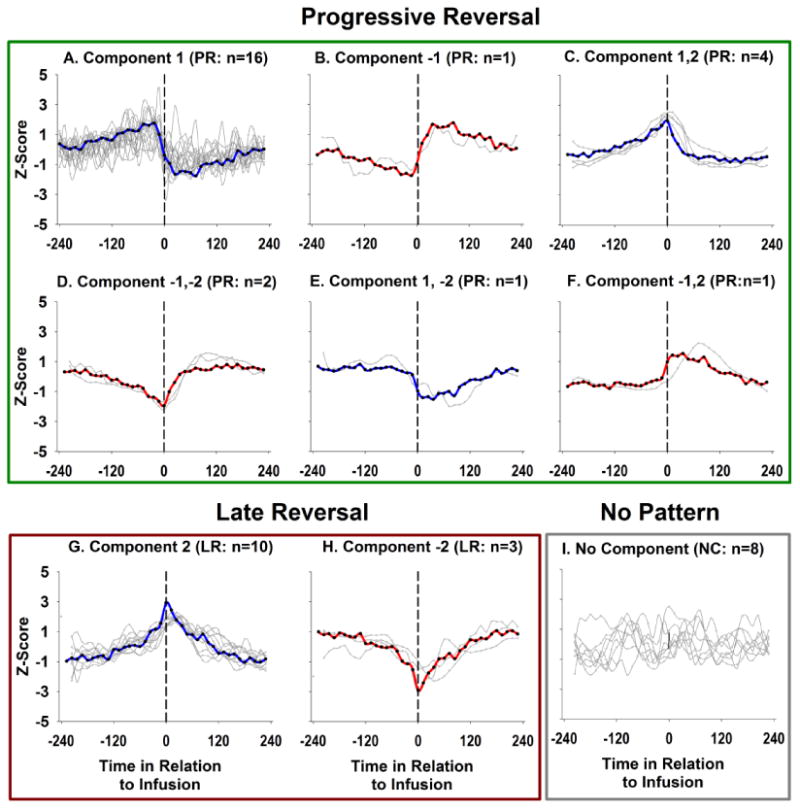
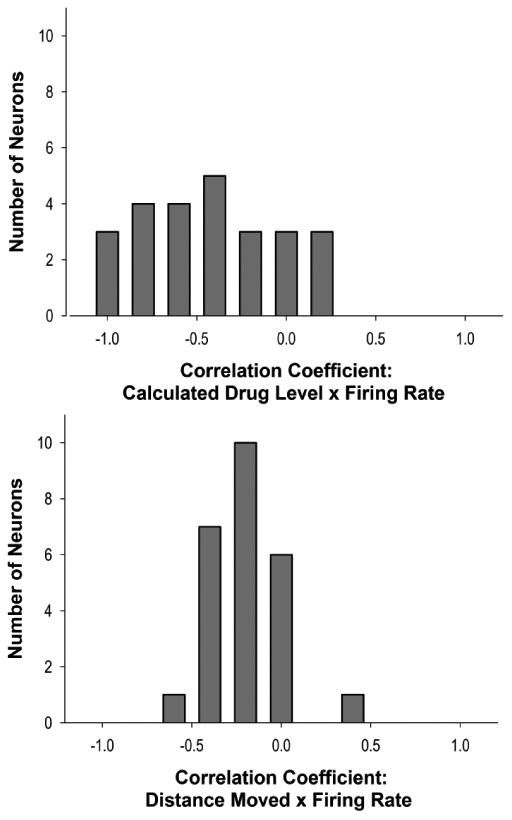
The lateral preoptic-rostral lateral hypothalamic continuum (LPH) receives projections from the nucleus accumbens and is believed to be one route by which nucleus accumbens signaling affects motivated behaviors. While accumbens firing patterns are known to be modulated by fluctuating levels of cocaine, studies of the LPH's drug-related firing are absent from the literature. The present study sought to electrophysiologically test whether drug-related tonic and slow-phasic patterns exist in the firing of LPH neurons during a free-access cocaine self-administration task. Results demonstrated that a majority of neurons in the LPH exhibited changes in both tonic and slow-phasic firing rates during fluctuating drug levels. During the maintenance phase of self-administration, 69.6% of neurons exhibited at least a twofold change in tonic firing rate when compared to their pre-drug firing rates. Moreover, 54.4% of LPH neurons demonstrated slow-phasic patterns, specifically "progressive reversal" patterns, which have been shown to be related to pharmacological changes across the inter-infusion interval. Firing rate was correlated with calculated drug level in 58.7% of recorded cells. Typically, a negative correlation between drug level and firing rate was observed, with a majority of neurons showing decreases in firing during cocaine self-administration. A small percentage of LPH neurons also exhibited correlations between locomotor behavior and firing rate; however, correlations with drug level in these same neurons were always stronger. Thus, the weak relationships between LPH firing and locomotor behaviors during cocaine self-administration do not account for the observed changes in firing. Overall, these findings suggest that a proportion of LPH neurons are sensitive to fluctuations in cocaine concentration and may contribute to neural activity that controls drug taking.
Figures
Similar articles
-
Slow phasic and tonic activity of ventral pallidal neurons during cocaine self-administration.Synapse. 2012 Feb;66(2):106-27. doi: 10.1002/syn.20990. Epub 2011 Nov 3. Synapse. 2012. PMID: 21953543 Free PMC article.
-
Electrophysiological evidence of mediolateral functional dichotomy in the rat nucleus accumbens during cocaine self-administration II: phasic firing patterns.Eur J Neurosci. 2010 May;31(9):1671-82. doi: 10.1111/j.1460-9568.2010.07230.x. Eur J Neurosci. 2010. PMID: 20525080 Free PMC article.
-
Phasic firing time locked to cocaine self-infusion and locomotion: dissociable firing patterns of single nucleus accumbens neurons in the rat.J Neurosci. 1998 Sep 15;18(18):7588-98. doi: 10.1523/JNEUROSCI.18-18-07588.1998. J Neurosci. 1998. PMID: 9736676 Free PMC article.
-
Nucleus accumbens cell firing during goal-directed behaviors for cocaine vs. 'natural' reinforcement.Physiol Behav. 2002 Jul;76(3):379-87. doi: 10.1016/s0031-9384(02)00760-6. Physiol Behav. 2002. PMID: 12117574 Review.
-
Application of Chronic Extracellular Recording Method to Studies of Cocaine Self-Administration: Method and Progress.In: Kuhn CM, Koob GF, editors. Advances in the Neuroscience of Addiction. Boca Raton (FL): CRC Press; 2010. Chapter 2. In: Kuhn CM, Koob GF, editors. Advances in the Neuroscience of Addiction. Boca Raton (FL): CRC Press; 2010. Chapter 2. PMID: 21656978 Free Books & Documents. Review.
Cited by
-
Lateral preoptic area neurons signal cocaine self-administration behaviors.Eur J Neurosci. 2021 Oct;54(7):6397-6405. doi: 10.1111/ejn.15452. Epub 2021 Sep 20. Eur J Neurosci. 2021. PMID: 34505325 Free PMC article.
-
The Lateral Preoptic Area: A Novel Regulator of Reward Seeking and Neuronal Activity in the Ventral Tegmental Area.Front Neurosci. 2020 Jan 17;13:1433. doi: 10.3389/fnins.2019.01433. eCollection 2019. Front Neurosci. 2020. PMID: 32009893 Free PMC article.
-
Multiplexed neurochemical signaling by neurons of the ventral tegmental area.J Chem Neuroanat. 2016 Apr;73:33-42. doi: 10.1016/j.jchemneu.2015.12.016. Epub 2016 Jan 4. J Chem Neuroanat. 2016. PMID: 26763116 Free PMC article. Review.
-
The ventral pallidum: Subregion-specific functional anatomy and roles in motivated behaviors.Prog Neurobiol. 2015 Jul;130:29-70. doi: 10.1016/j.pneurobio.2015.03.005. Epub 2015 Apr 6. Prog Neurobiol. 2015. PMID: 25857550 Free PMC article. Review.
References
-
- Brudzynski MS, Mogenson GJ. Association of the mesencephalic locomotor region with locomotor activity induced by injections of amphetamine into the nucleus accumbens. Brain Res. 1985;334(1):77–84. - PubMed
-
- Burgdorf J, Knutson B, Panksepp J, Ikemoto S. Nucleus accumbens amphetamine microinjections unconditionally elicit 50-kHz ultrasonic vocalizations in rats. Behavioral neuroscience. 2001;115(4):940. - PubMed
-
- Comrey AL. A first course on factor analysis. New York, NY: Academic Press; 1973.
Publication types
MeSH terms
Substances
Grants and funding
LinkOut - more resources
Full Text Sources
Other Literature Sources
