

Three-dimensional pulmonary perfusion MRI with radial ultrashort echo time and spatial-temporal constrained reconstruction
- PMID: 24604452
- PMCID: PMC4156934
- DOI: 10.1002/mrm.25158
Three-dimensional pulmonary perfusion MRI with radial ultrashort echo time and spatial-temporal constrained reconstruction
Abstract
Purpose: To assess the feasibility of spatial-temporal constrained reconstruction for accelerated regional lung perfusion using highly undersampled dynamic contrast-enhanced (DCE) three-dimensional (3D) radial MRI with ultrashort echo time (UTE).
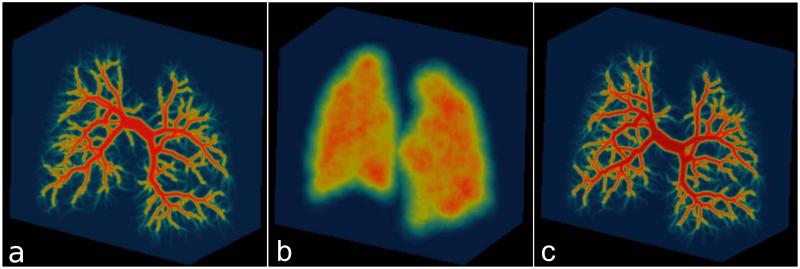
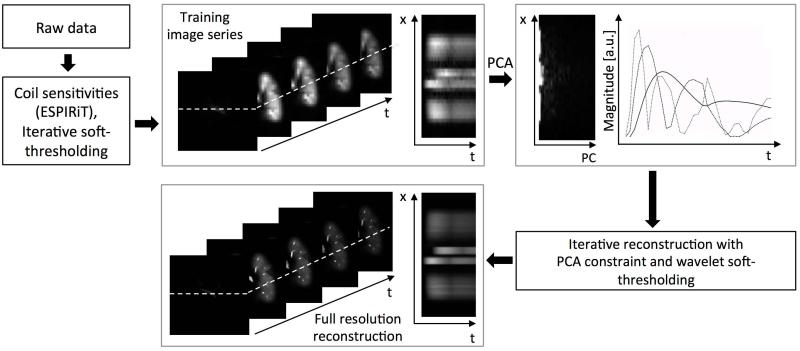
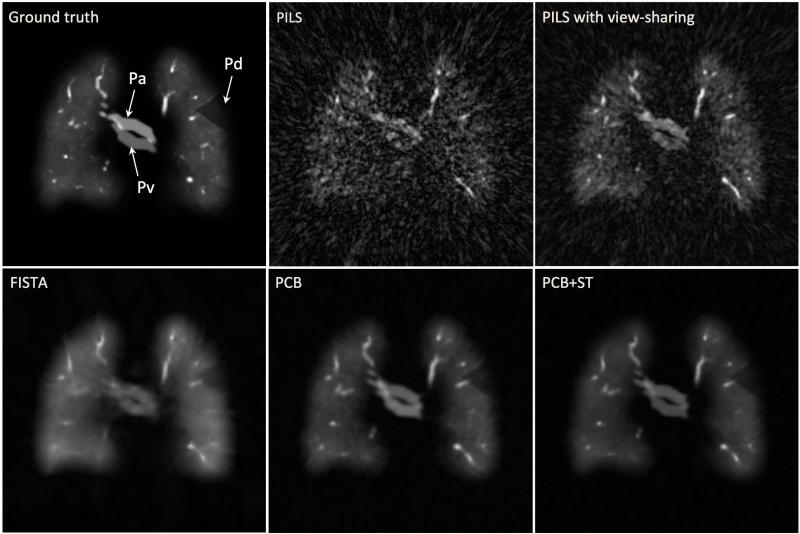
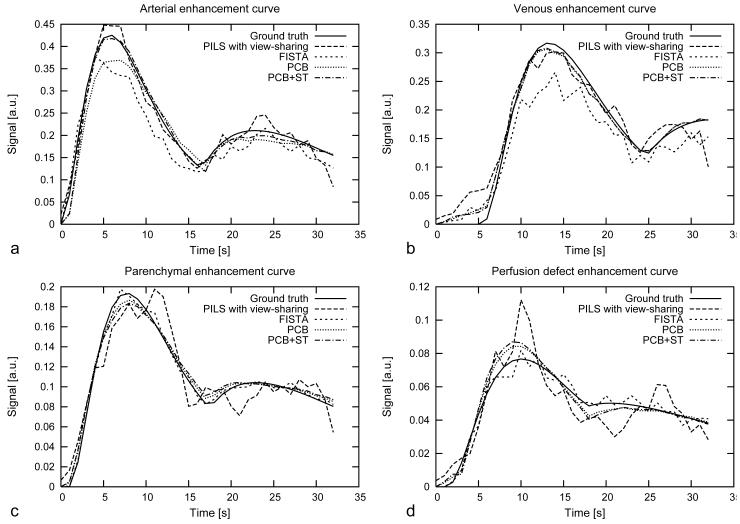
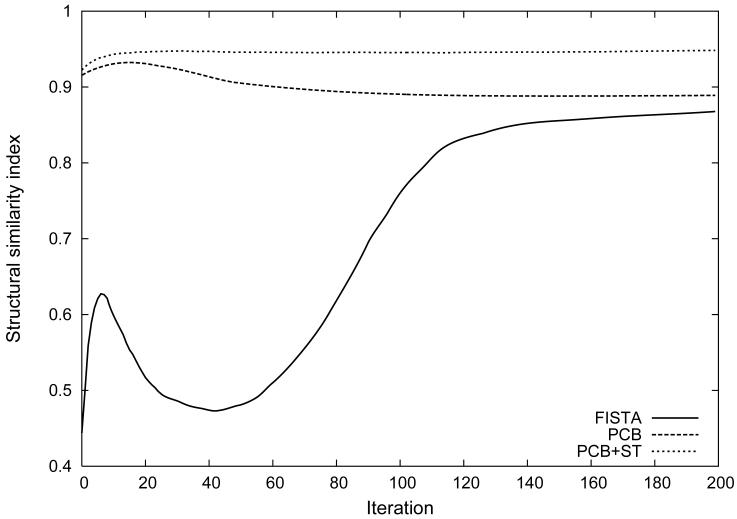
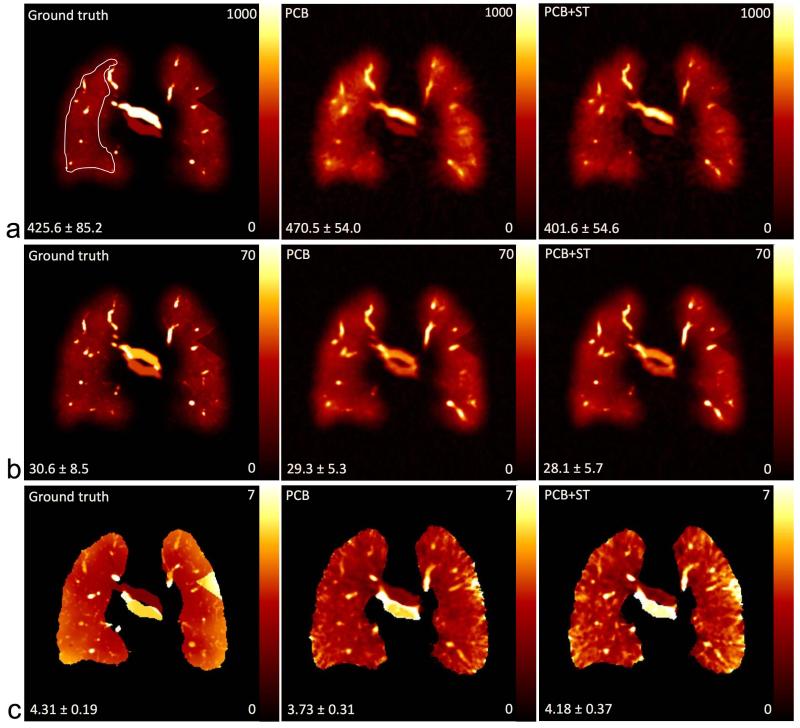
Methods: A combined strategy was used to accelerate DCE MRI for 3D pulmonary perfusion with whole lung coverage. A highly undersampled 3D radial UTE MRI acquisition was combined with an iterative constrained reconstruction exploiting principal component analysis and wavelet soft-thresholding for dimensionality reduction in space and time. The performance of the method was evaluated using a 3D fractal-based DCE digital lung phantom. Simulated perfusion maps and contrast enhancement curves were compared with ground truth using the structural similarity index (SSIM) to determine robust threshold and regularization levels. Feasibility studies were then performed in a canine and a human subject with 3D radial UTE (TE=0.08 ms) acquisition to assess feasibility of mapping regional 3D perfusion.
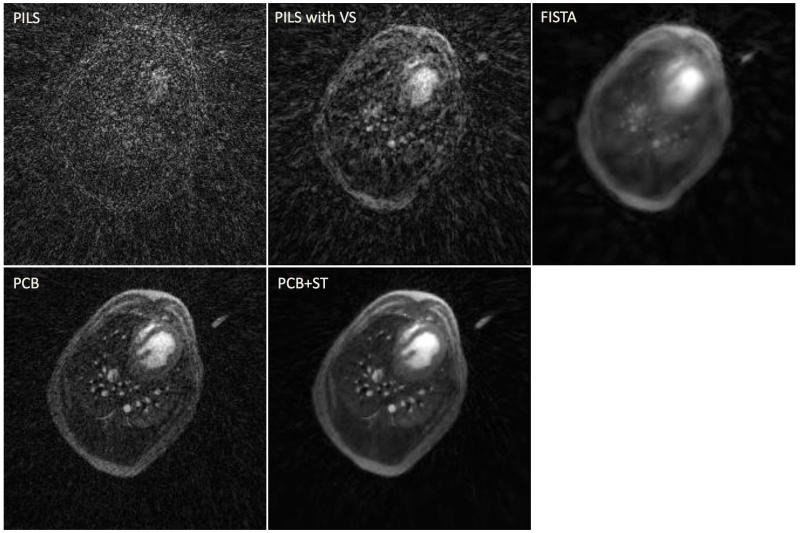
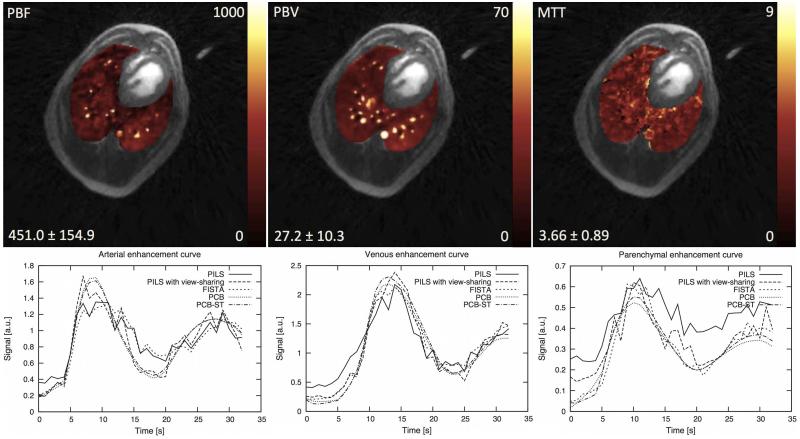
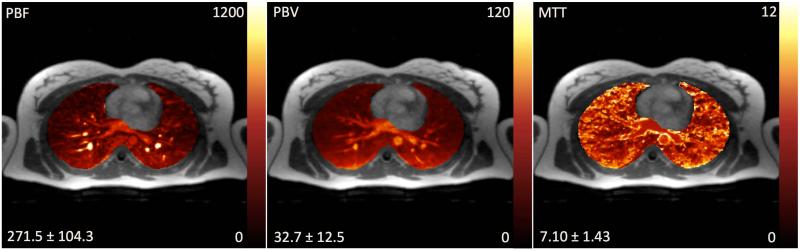
Results: The method was able to accurately recover perfusion maps in the phantom with a nominal isotropic spatial resolution of 1.5 mm (SSIM of 0.949). The canine and human subject studies demonstrated feasibility for providing artifact-free perfusion maps in a simple 3D breath-held acquisition.
Conclusion: The proposed method is promising for fast and flexible 3D pulmonary perfusion imaging. Magn Reson
Keywords: MRI; UTE; compressed sensing; image reconstruction; lung perfusion; principal component analysis; radial; wavelets.
© 2014 Wiley Periodicals, Inc.
Figures
References
-
- Patz EF, Coleman RE. Nuclear medicine techniques. In: Mason RJ, Murray J, Broaddus VC, Nadel J, editors. Textbook of Respiratory Medicine. Saunders Elsevier; Philadelphia, PA, USA: 2005. pp. 594–599.
-
- Roach PJ, Bailey DL, Harris BE. Enhancing lung scintigraphy with single-photon emission computed tomography. Semin Nucl Med. 2008;38(6):441–99. - PubMed
-
- Vidal Melo MF, Layfield D, Harris RS, O’Neill K, Musch G, Richter T, Winkler T, Fischman AJ, Venegas JG. Quantification of regional ventilation-perfusion ratios with PET. J Nucl Med. 2003;44:1982–91. - PubMed
-
- Chae EJ, Seo JB, Goo HW, Kim N, Song KS, Lee SD, Hong SJ, Krauss B. Xenon ventilation CT with a dual-energy technique of dual-source CT: initial experience. Radiology. 2008;248(2):615–24. - PubMed
-
- Donadieu J, Roudier C, Saguintaah M, Maccia C, Chiron R. Estimation of the radiation dose from thoracic CT scans in a cystic fibrosis population. Chest. 2007;132(4):1233–8. - PubMed
Publication types
MeSH terms
Grants and funding
- R01NS065034/NS/NINDS NIH HHS/United States
- 5T32 CA009206-31/CA/NCI NIH HHS/United States
- T32 CA009206/CA/NCI NIH HHS/United States
- UL1 RR025011/RR/NCRR NIH HHS/United States
- UL1TR000427/TR/NCATS NIH HHS/United States
- KL2 TR000428/TR/NCATS NIH HHS/United States
- 1UL1RR025011/RR/NCRR NIH HHS/United States
- R01 NS065034/NS/NINDS NIH HHS/United States
- R01 NS066982/NS/NINDS NIH HHS/United States
- R21 EB009441/EB/NIBIB NIH HHS/United States
- UL1 TR000427/TR/NCATS NIH HHS/United States
- 9U54TR000021/TR/NCATS NIH HHS/United States
- R01NS066982/NS/NINDS NIH HHS/United States
LinkOut - more resources
Full Text Sources
Other Literature Sources
