. 2014 May;24(5):860-8.
doi: 10.1101/gr.167668.113. Epub 2014 Mar 6.

General approach for in vivo recovery of cell type-specific effector gene sets

Affiliations

General approach for in vivo recovery of cell type-specific effector gene sets

Julius C Barsi et al. Genome Res. 2014 May.

Abstract

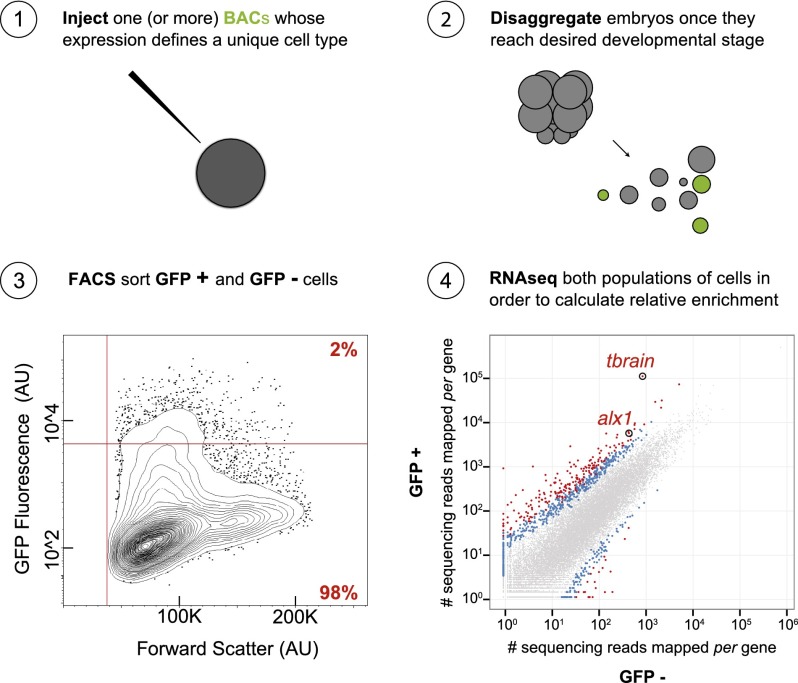
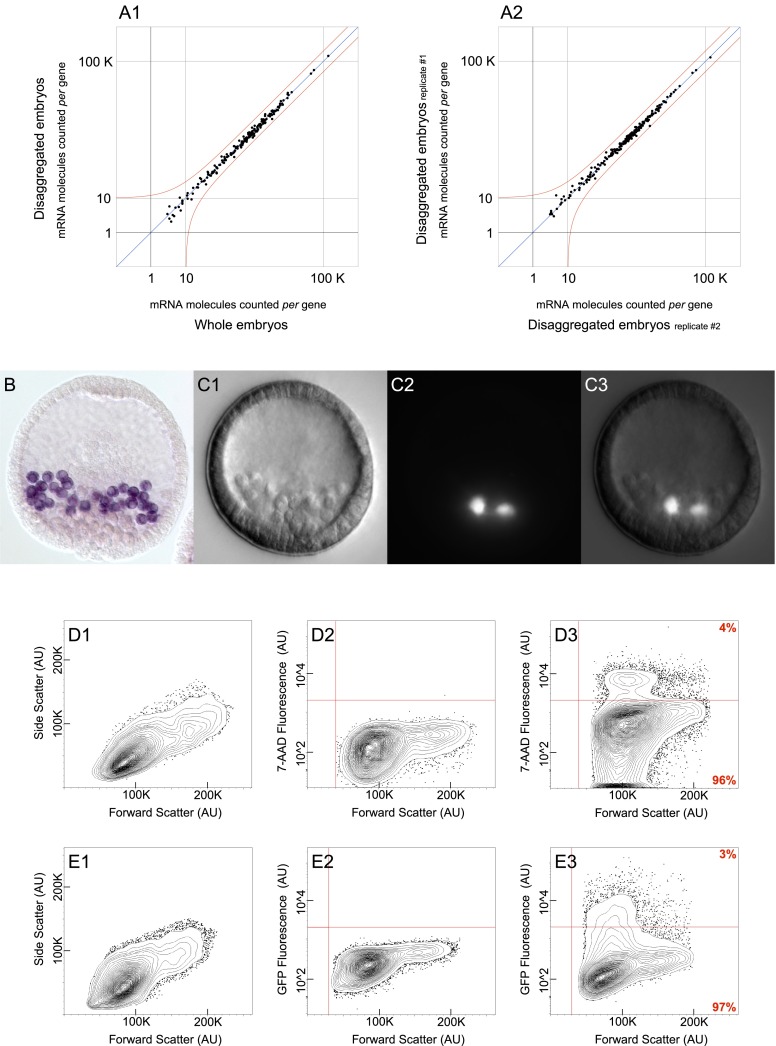
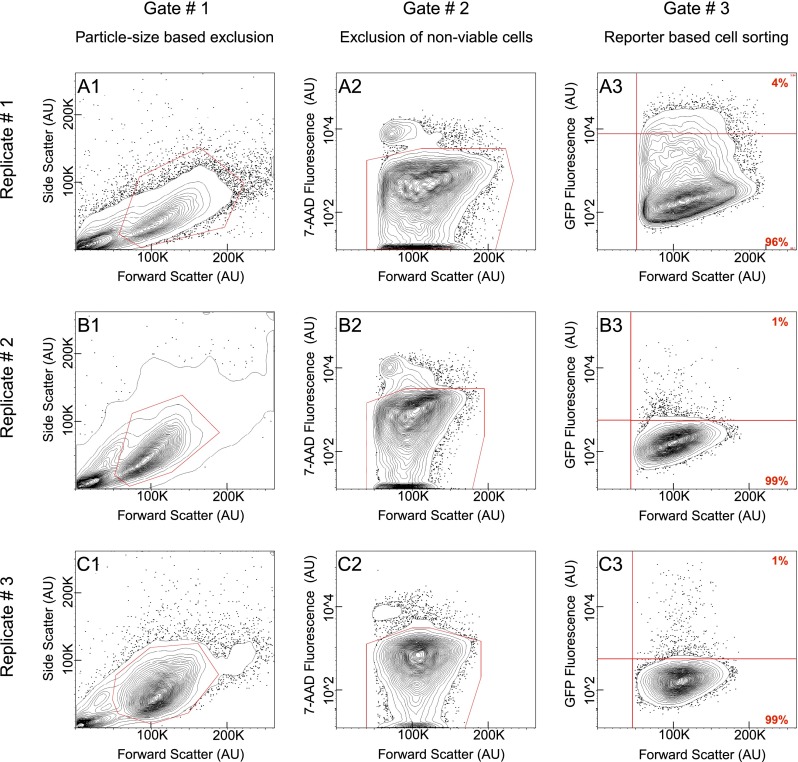
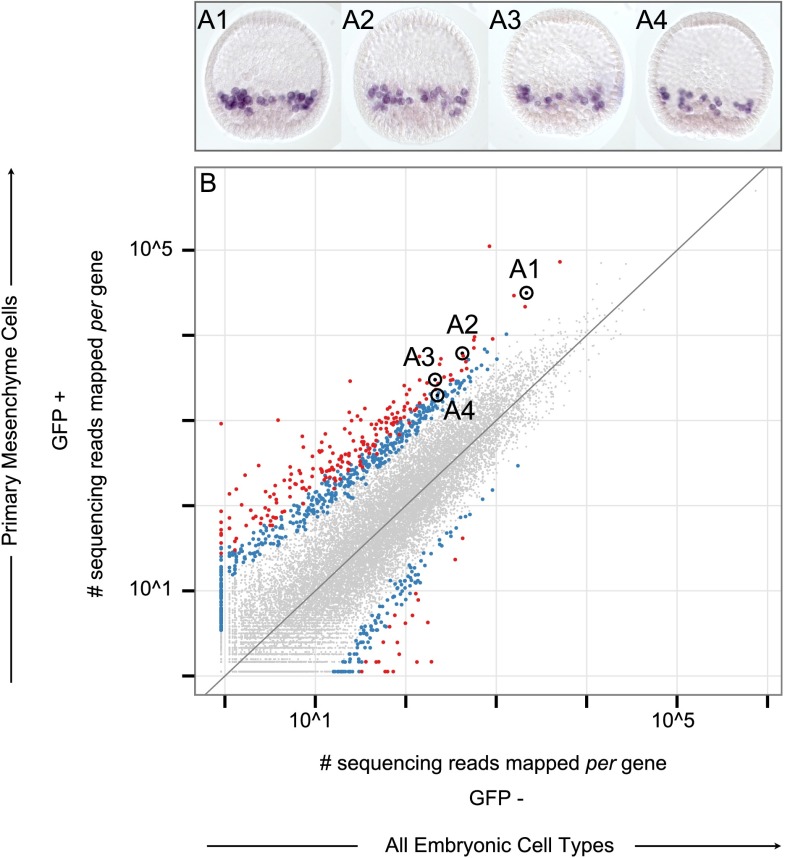
Differentially expressed, cell type-specific effector gene sets hold the key to multiple important problems in biology, from theoretical aspects of developmental gene regulatory networks (GRNs) to various practical applications. Although individual cell types of interest have been recovered by various methods and analyzed, systematic recovery of multiple cell type-specific gene sets from whole developing organisms has remained problematic. Here we describe a general methodology using the sea urchin embryo, a material of choice because of the large-scale GRNs already solved for this model system. This method utilizes the regulatory states expressed by given cells of the embryo to define cell type and includes a fluorescence activated cell sorting (FACS) procedure that results in no perturbation of transcript representation. We have extensively validated the method by spatial and qualitative analyses of the transcriptome expressed in isolated embryonic skeletogenic cells and as a consequence, generated a prototypical cell type-specific transcriptome database.


Figures

Figure 1.
Figure 1.
Steps required for attaining cell type-specific transcriptomes. (1) Microinject a group of zygotes with an artificial chromosome genetically engineered to express a fluorescent reporter in the cell type of interest; (2) culture transgenic zygotes until they have reached the desired developmental stage, then disaggregate the embryos to individual cells; (3) run the cells through flow cytometry in order to segregate populations of cells by way of FACS; and (4) isolate, amplify, sequence, and quantify the pool of mRNA from each population in order to calculate relative enrichment for each gene. (AU) Arbitrary units; (BACs) bacterial artificial chromosomes.
Figure 2.
Figure 2.
Assemblage of control experiments. (A) nCounter analysis system measurements quantifying the expression level of 181 regulatory mRNAs used to assess the gene expression profile of disaggregated embryos. Red line represents a twofold change in gene expression from moderate abundance onward. (A1) Cells from disaggregated embryos collected by flow cytometry show no change in gene expression when compared to undisturbed whole embryos. (A2) Cells from disaggregated embryos collected by flow cytometry show no change in gene expression among biological replicates. (B) Fixed Sp blastula with PMCs labeled in purple. Labeling was achieved by whole mount RNA in situ hybridization of cah10l mRNA. (C) Live transgenic Sp blastula carrying an artificial chromosome that contains GFP under control of the cis-regulatory apparatus governing tbr expression. (C1) DIC image of transgenic blastula. (C2) Epifluorescent image of the same specimen shown in C1 reveals that GFP is exclusively expressed in PMCs. (C3) Composite image generated by merging C1 with C2. (D,E) Flow cytometry data in the form of 2% probability contour plots. Events falling outside of the lowest contour have been depicted as dots within the graph. A vertical red line demarcates the value beneath which an event likely reflects a technical artifact. (D) The exclusion of nonviable cells required that threshold parameters be calibrated for 7-AAD fluorescence. (D1) Data reflects the variation in size among the cells utilized for 7-AAD calibration. (D2) Untreated cells were used in determining baseline fluorescence, depicted as a horizontal red line. (D3) Following 7-AAD treatment, cells observed to fluoresce above baseline were excluded from further analysis. (E) Segregation of cell populations by FACS required that threshold parameters be calibrated for GFP fluorescence. (E1) Data reflects the variation in size among the cells utilized for GFP calibration. (E2) Cells from uninjected embryos were used in determining baseline fluorescence, depicted as a horizontal red line. (E3) Cells from transgenic embryos were then segregated by FACS, according to their fluorescence relative to baseline. (AU) Arbitrary units.
Figure 3.
Figure 3.
Flow cytometry gating strategy across replicates. (A1C3) Flow cytometry data in the form of 2% probability contour plots. In all instances, events falling outside the lowest contour have been depicted as dots within the graph. (A,B,C) Each series reflects data from one of the three replicates. (A) Replicate #1 obtained by using an alx1:GFP BAC. Replicate #2 (B) and Replicate #3 (C) obtained by using a tbr:GFP BAC. (A1,B1,C1) Each graph depicts all the events detected by flow cytometry. Events enclosed within the polygonal red line were visually corroborated to constitute individual cells, hence promoted to a second round of analysis. (A2,B2,C2) Each graph reflects the fraction of cells that have incorporated 7-AAD. Consequently, these were excluded from further study. A polygonal red line encloses the cell population promoted to a third and final round of analysis. (A3,B3,C3) Each graph reflects the fraction of viable cells segregated by GFP FACS. Data points shown above the horizontal red line represent PMCs, whereas those below represent a heterogeneous population containing all cell types. Percentage displayed in red at the corner of each quadrant. A vertical red line demarcates the value beneath which an event likely reflects a technical artifact. (AU) Arbitrary units.
Figure 4.
Figure 4.
Cell type-specific transcriptome. (A–D) Scatterplots compare transcriptome data unique to PMCs (GFP+) with that of all cell types (GFP−). Each data point reflects the relative mRNA abundance of a gene as estimated by the number of sequencing reads that map to its locus. The values in the graph reflect measurements taken across three independent replicates. Data points that fall above the diagonal indicate augmented levels of expression among PMCs, relative to other cell types. Genes statistically determined to be differentially expressed are shown as data points colored either red or blue to indicate an associated P-value of less than 0.01 or 0.05, respectively. Data points corresponding to genes of interest have been encircled in order to distinguish them from the rest of the data set. In select cases, a label revealing gene identity accompanies encircled data points. (A) The cohort of transcription factors enriched among PMCs is in accordance with, and expands upon, the known PMC regulatory state. (B) Genes directly involved in biomineralization are overrepresented in the catalog of PMC enriched transcripts, illuminating the skeletogenic fate these cells acquire. (C) Marked data points reflect the subset of PMC enriched transcripts for which spatial expression has been corroborated by RNA in situ hybridization. (D) Marked data points reflect genes reported in the literature to be enriched within PMCs.
Figure 5.
Figure 5.
Corroboration of cell type specificity. (A1A4) Four of the genes tested for cell type-specific expression. Fixed Sp blastula with PMCs labeled in purple. Labeling was achieved by whole mount RNA in situ hybridization of cah10l (A1), msp130r1 (A2), p16 (A3), and 3apcol (A4). (B) Scatterplot identical to those described in Figure 4. Data points corresponding to the genes shown in A1A4 have been encircled in order to distinguish them from other differentially expressed genes and labeled accordingly. Supplemental Table 1 lists all genes corroborated in a similar manner and the supporting data are shown in Supplemental Figures 4–12.

References

    1. Anders S, Huber W 2010. Differential expression analysis for sequence count data. Genome Biol 11: R106. - PMC - PubMed
    1. Ben-Tabou de-Leon S, Su Y-H, Lin K-T, Li E, Davidson EH 2013. Gene regulatory control in the sea urchin aboral ectoderm: spatial initiation, signaling inputs, and cell fate lockdown. Dev Biol 374: 245–254 - PMC - PubMed
    1. Cannon JE, Place ES, Eve AMJ, Bradshaw CR, Sesay A, Morrell NW, Smith JC 2013. Global analysis of the haematopoietic and endothelial transcriptome during zebrafish development. Mech Dev 130: 122–131 - PMC - PubMed
    1. Damle S, Davidson EH 2011. Precise cis-regulatory control of spatial and temporal expression of the alx-1 gene in the skeletogenic lineage of s. purpuratus. Dev Biol 357: 505–517 - PMC - PubMed
    1. Davidson EH. 2006. The regulatory genome. Academic, Burlington, MA.

Publication types

LinkOut - more resources