. 2014 Feb 24:8:57.
doi: 10.3389/fncel.2014.00057. eCollection 2014.

Six-color intravital two-photon imaging of brain tumors and their dynamic microenvironment

Affiliations

Six-color intravital two-photon imaging of brain tumors and their dynamic microenvironment

Clément Ricard et al. Front Cell Neurosci. .

Abstract

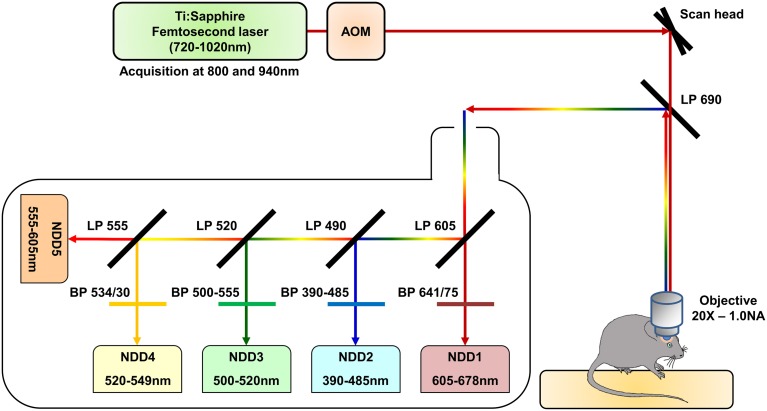
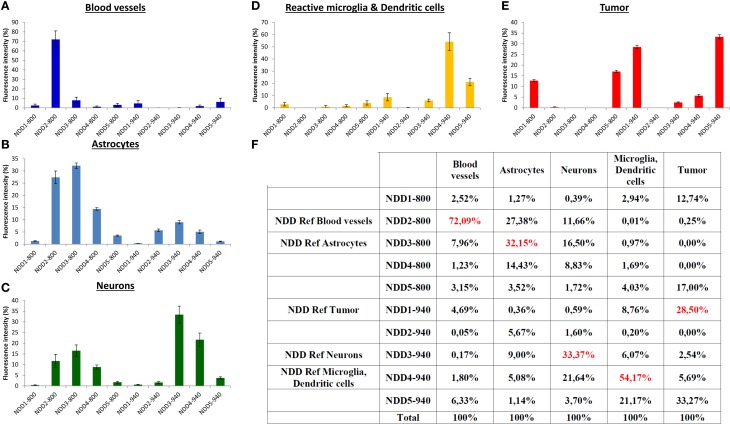
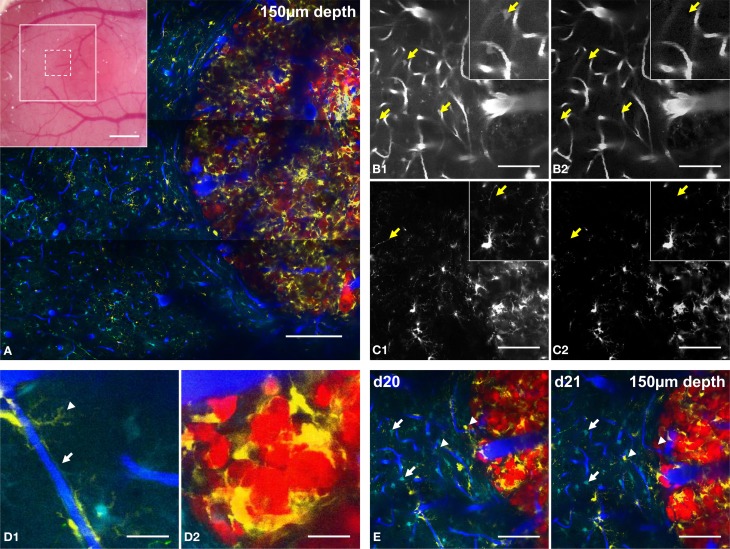
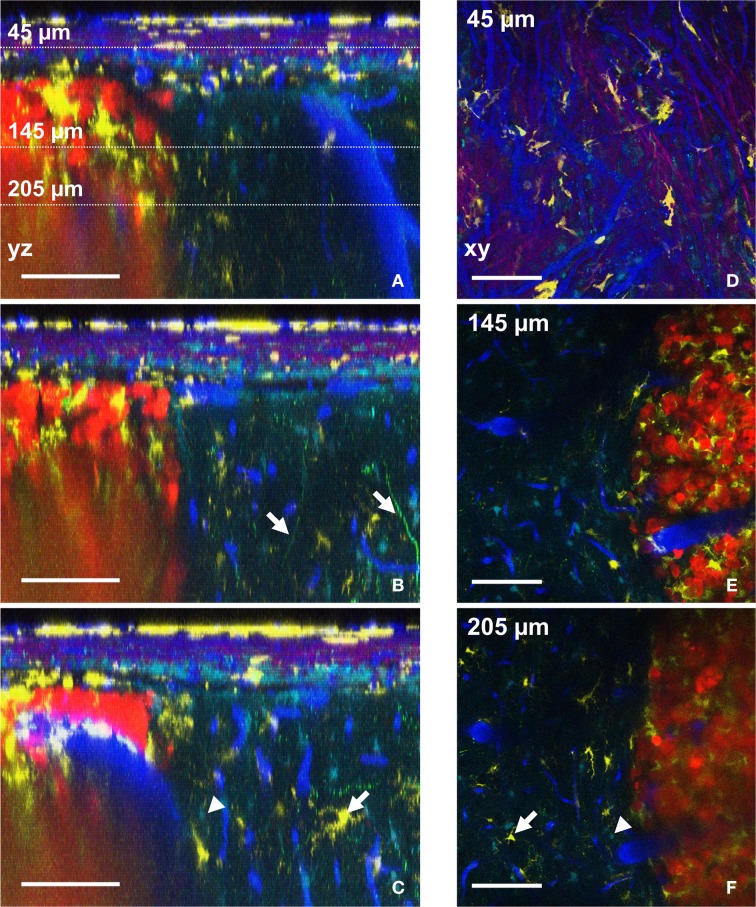
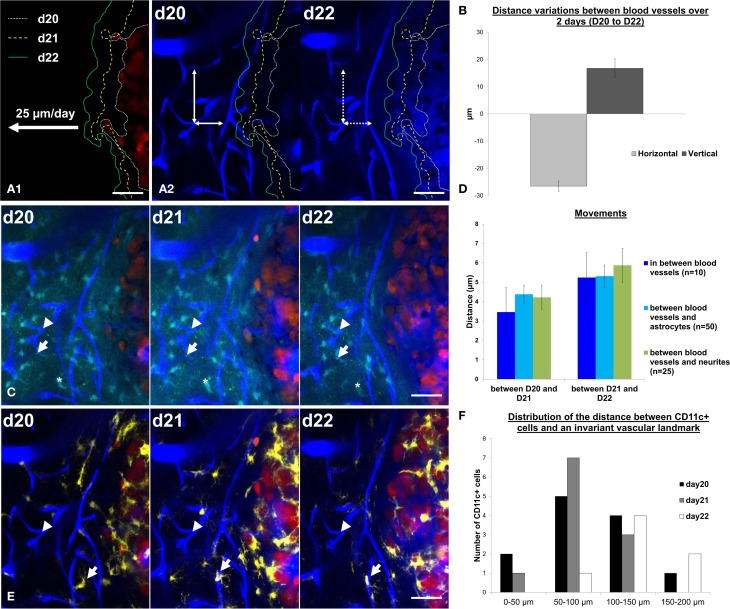
The majority of intravital studies on brain tumor in living animal so far rely on dual color imaging. We describe here a multiphoton imaging protocol to dynamically characterize the interactions between six cellular components in a living mouse. We applied this methodology to a clinically relevant glioblastoma multiforme (GBM) model designed in reporter mice with targeted cell populations labeled by fluorescent proteins of different colors. This model permitted us to make non-invasive longitudinal and multi-scale observations of cell-to-cell interactions. We provide examples of such 5D (x,y,z,t,color) images acquired on a daily basis from volumes of interest, covering most of the mouse parietal cortex at subcellular resolution. Spectral deconvolution allowed us to accurately separate each cell population as well as some components of the extracellular matrix. The technique represents a powerful tool for investigating how tumor progression is influenced by the interactions of tumor cells with host cells and the extracellular matrix micro-environment. It will be especially valuable for evaluating neuro-oncological drug efficacy and target specificity. The imaging protocol provided here can be easily translated to other mouse models of neuropathologies, and should also be of fundamental interest for investigations in other areas of systems biology.

Keywords: brain tumors; cellular interactions; cranial window; intravital imaging; multicolor transgenic mouse; spectral deconvolution; two-photon microscopy.


Figures

Figure 1
Figure 1
Schematic representation of the two-photon microscopy setup. The excitation beam is produced by a femtosecond pulsed infrared tunable (720–1020 nm) laser (Mai-Tai, Spectra Physics). The laser power is modulated by an Acousto-Optic Modulator (AOM). The beam is scanned in the xy direction by galvanometric mirrors present in the scan head of a Zeiss LMS 7 MP two-photon microscope. The beam then passes through a LP690 dichroic mirror and is focused in the brain of the anaesthetized animal by a 20X-1.0 NA water immersion objective. The emitted epifluorescence is collected and reflected by the LP690 mirror in a non-descanned mode. The fluorescence is finally splitted and filtered using a set of dichroic mirrors and filters and collected by a set of 5 non-descanned detectors mounted in cascade (NDD). The characteristics of the dichroic mirrors and filters are depicted on the scheme.
Figure 2
Figure 2
Normalized spectral signatures of each biological element on the non-descanned detectors array. (A–E) normalized (%) contribution of each element on the NDDs for excitations at 800 nm (NDD1-800–NDD5-800) and 940 nm (NDD1-940–NDD5-940). (F) Numerical values (%) used for spectral deconvolution (red: contribution of the element of interest in its reference NDD).
Figure 3
Figure 3
Five-color intravital two-photon imaging of glioblastoma tumor and its dynamic environment. (A) 5-colors tile scan (3 × 3 images) of the GBM and its microenvironment; inset: macroscopic image of the cranial window with the area covered by the tile scan (large white square) and the area covered by a single plane acquisition (small dotted square). (B) Image of vasculature taken from NDD2-800 before (B1) and after (B2) spectral deconvolution; arrows: location of identified astrocytes that are removed from the image after spectal deconvolution; inset: zoom (100 × 100 μm). (C) Image of CD11c-positive cells taken from NDD4-940 before (C1) and after (C2) spectral deconvolution; arrows: location of identified neurons that are removed after spectal deconvolution; inset: zoom (100 × 100 μm). Note that the background generated by DsRed positive tumor cells is removed from the image (D). Examples of cellular interactions at the level of their fine processes. (D1) zoom of a CD11c-positive cell wrapping its processes around a blood vessel (arrowhead) and of an astrocyte whose processes contact the vessel walls as part of the blood-brain-barrier (arrow); (D2): zoom of CD11c-positive cells surrounding tumor cells in the tumor core. (E) Same field of view at day 20 (d20) and day 21 (d21) post-implantation; note that astrocytes are stable (arrows) while CD11c-positive cells appear or disappear (arrowheads). Colors: blue: vasculature, cyan: astrocytes, green: neurons, yellow: CD11c-positive cells, red: tumor cells. Scale bars: (A): 200 μm (inset: 500 μm), (B–E): 100 μm. All images were taken at 150 μm depth.
Figure 4
Figure 4
Distributions of six components assessed by intravital two-photon imaging. (A–C) Orthogonal reconstructions obtained from a stack acquired from 0 to 300 μm below the glass coverslip with a z-step of 3 μm. Each YZ image shows the maximum intensity projection over 10 microns along the X axis. (A) Note the vertical orientation of major brain vessels; dotted lines: the levels of xy-sections are shown in D–F. (B) Apical dendrites of neurons are visible (arrows). (C) Astrocyte (arrowhead) and CD11c-positive cell (arrow) also visible in F. (D–F) xy-sections taken at 45 μm (D), 145 μm (E), and 205 μm (F) below the glass coverslip. (D) Note the SHG signal (magenta) corresponding to the collagen fibers at the level of the dura-mater. (E) CD11c-positive cells have invaded the tumor but not surrounding healthy tissues. (F) Astrocyte (arrowhead) and CD11c-positive cell (arrow) also visible in (C). Colors: blue: vasculature, cyan: astrocytes, green: neurons, yellow: CD11c-positive cells, magenta: SHG signal (dura-mater), red: tumor cells. Scale bars: 100 μm.
Figure 5
Figure 5
Cell dynamics and deformations due to tumor growth can be tracked over time. (A1) Tumor margin are highlighted at day 20 (d20, white small dotted line), day 21 (d21, yellow dotted line) and day 22 (d22, green line). Tumor expansion rates were measured at 25 ± 2 μm/day. (A2) Tumor margins at d20, d21, and d22 were overlaid on vasculature images at day 20 and day 22. Notice the decrease of the distances between blood vessels in the horizontal direction (in the direction of tumor growth, horizontal double-arrow) and an increase in the vertical direction (perpendicular to the direction of tumor growth, vertical double-arrow). Movements between d20 and d22 are highlighted by the mismatch between arrowheads and vessel walls (dotted line on d22). (B) Quantification of the distance variation (μm) between blood vessels in the horizontal direction (in the direction of tumor growth, light gray) and in the vertical direction (perpendicular to the direction of tumor growth, dark gray). (C) z-projection of 6 slices over 15 μm in the same field of view at day 20, day 21, and day 22 on a xyz registered image. Vascular landmarks (blue, arrowhead), astrocytes (cyan, asterisk) and neurites (green dots, arrow) appear stable over the observation period. (D) Quantification of the movements (between d20 and d21, left panel and between d21 and d22, right panel) between blood vessels (blue, n = 10 measurements), of astrocytes relative to blood vessels (cyan, n = 50 measurements) and of neurites relative to blood vessels (green, n = 25 measurements). (E) Same field of view as in C (z-projection of 6 slices over 15 μm) at day 20, day 21, and day 22 on a xyz registered image showing only the CD11c (yellow), blood vessels (blue) and tumor (red) channels for the sake of clarity. Note the dynamics of one CD11c-positive cell identified by an arrow. (F) Frequency distribution of the distances to peritumoral CD11c-positive cell somas relative to a reference vascular landmark (arrowhead in E) at day 20, day 21, and day 22. Colors: blue: vasculature, cyan: astrocytes, green: neurons, yellow: CD11c-positive cells, red: tumor cells. Scale bars: 50 μm.

References

    1. Abbott N. J., Ronnback L., Hansson E. (2006). Astrocyte-endothelial interactions at the blood brain barrier. Nat. Rev. Neurosci. 7, 41–53 10.1038/nrn1824 - DOI - PubMed
    1. Charles N. A., Holland E. C., Gilbertson R., Glass R., Kettenmann H. (2011). The brain tumor microenvironment. Glia 59, 1169–1180 10.1002/glia.21136 - DOI - PubMed
    1. Cicchi R., Vogler N., Kapsokalyvas D., Dietzek B., Popp J., Pavone F. S. (2013). From molecular structure to tissue architecture: collagen organization probed by SHG microscopy. J. Biophotonics 6, 129–142 10.1002/jbio.201200092 - DOI - PubMed
    1. Deangelis L. M. (2001). Brain tumors. N. Engl. J. Med. 344, 114–123 10.1056/NEJM200101113440207 - DOI - PubMed
    1. Degen J., Dublin P., Zhang J., Dobrowolski R., Jokwitz M., Karram K., et al. (2012). Dual reporter approaches for identification of Cre efficacy and astrocyte heterogeneity. FASEB J. 26, 4576–4583 10.1096/fj.12-207183 - DOI - PubMed

LinkOut - more resources