Review
. 2014 Jan 16:5:44-67.
doi: 10.3762/bjnano.5.5. eCollection 2014.

Design criteria for stable Pt/C fuel cell catalysts

Affiliations
Review

Design criteria for stable Pt/C fuel cell catalysts

Josef C Meier et al. Beilstein J Nanotechnol. .

Abstract

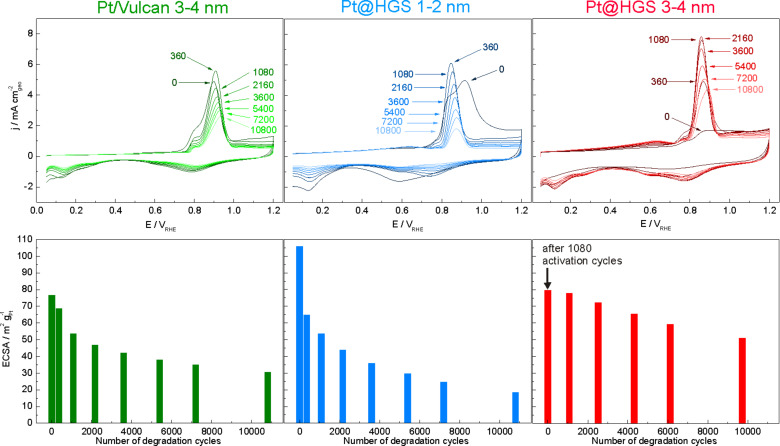
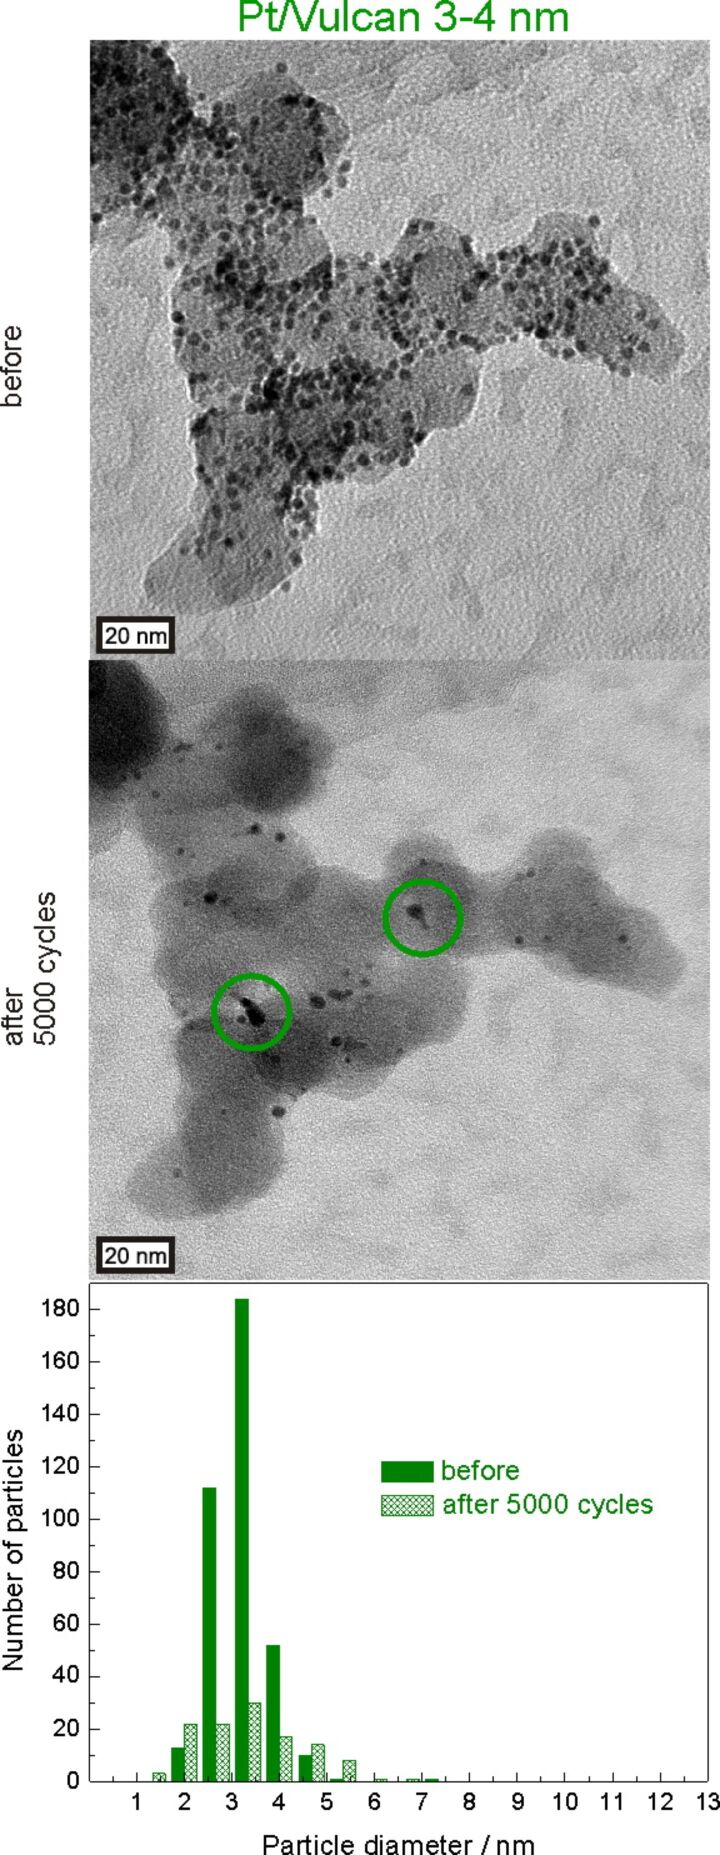
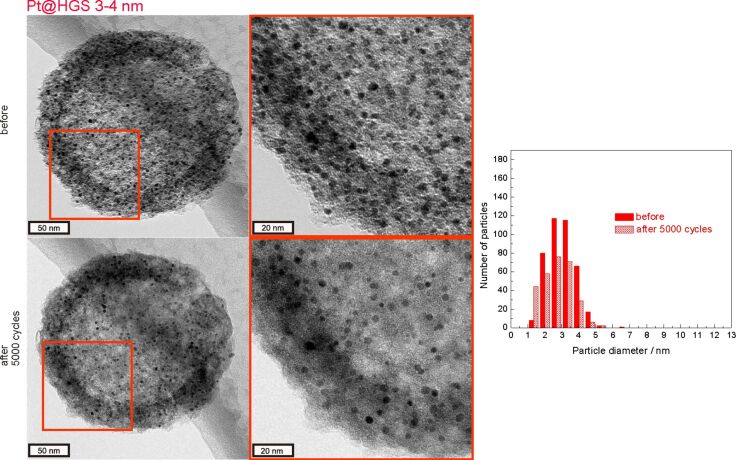
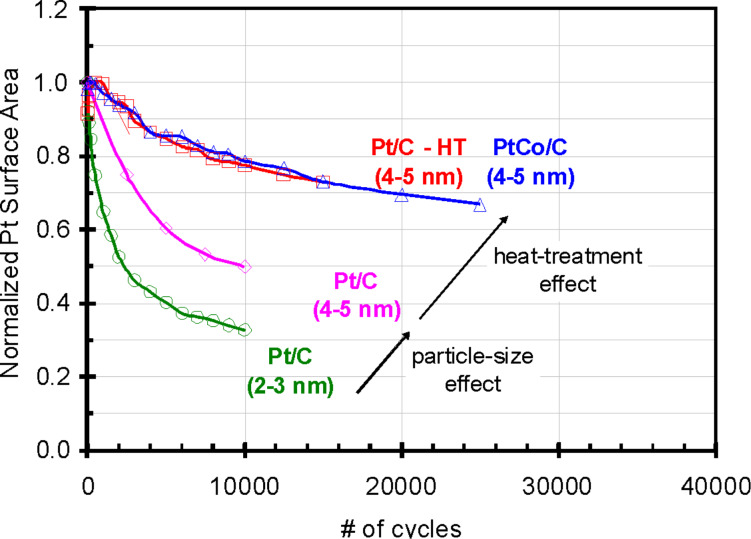
Platinum and Pt alloy nanoparticles supported on carbon are the state of the art electrocatalysts in proton exchange membrane fuel cells. To develop a better understanding on how material design can influence the degradation processes on the nanoscale, three specific Pt/C catalysts with different structural characteristics were investigated in depth: a conventional Pt/Vulcan catalyst with a particle size of 3-4 nm and two Pt@HGS catalysts with different particle size, 1-2 nm and 3-4 nm. Specifically, Pt@HGS corresponds to platinum nanoparticles incorporated and confined within the pore structure of the nanostructured carbon support, i.e., hollow graphitic spheres (HGS). All three materials are characterized by the same platinum loading, so that the differences in their performance can be correlated to the structural characteristics of each material. The comparison of the activity and stability behavior of the three catalysts, as obtained from thin film rotating disk electrode measurements and identical location electron microscopy, is also extended to commercial materials and used as a basis for a discussion of general fuel cell catalyst design principles. Namely, the effects of particle size, inter-particle distance, certain support characteristics and thermal treatment on the catalyst performance and in particular the catalyst stability are evaluated. Based on our results, a set of design criteria for more stable and active Pt/C and Pt-alloy/C materials is suggested.

Keywords: catalyst design criteria; degradation mechanisms; fuel cell catalyst; nanoparticles; stability.


Figures

Figure 1
Figure 1
Simplified representation of suggested degradation mechanisms for platinum particles on a carbon support in fuel cells.
Figure 2
Figure 2
A) ORR cyclic voltammograms of Pt@HGS 1–2 nm in 0.1 M HClO4 saturated with Ar (black) and with oxygen at (400–2500 rpm, blue) recorded at room temperature with a sweep rate of 0.05 V·s−1. B) Same as in A) after subtraction of capacitive currents. C) Plot of the specific activity as derived from the anodic scan at 0.9 VRHE versus the electrochemically active surface area of platinum illustrating the particle size dependent changes in activity. D) Tafel plots from a representative measurement of Pt-poly (orange), Pt@HGS 1–2 nm (blue), Pt@HGS 3–4 nm (red) and Pt/Vulcan 3–4 nm (green). The three Tafel plots of the Pt/C catalysts are almost identical, which indicates comparable specific activities of Pt@HGS based catalysts with standard high surface area fuel cell catalysts.
Figure 3
Figure 3
Electrochemical oxidation of a carbon monoxide monolayer (CO-stripping curves) after 0, 360, 1080, 2160, 3600, 5400, 7200 and 10800 degradation cycles for Pt/Vulcan 3–4 nm, Pt@HGS 1–2 nm and Pt@HGS 3–4 nm. The degradation cycles are performed between 0.4 and 1.4 VRHE with a scan rate of 1 V·s−1 without rotation at room temperature in argon-saturated 0.1 M HClO4 (not shown). CO-stripping voltammograms (top) were recorded between 0.05 and 1.2 VRHE at a scan rate of 0.05 V·s−1 to measure the ECSA versus the number of cycles (bottom). The CO-stripping voltammograms of Pt@HGS 3–4 nm are reprinted with permission from [71]. Copyright 2012 American Chemical Society.
Figure 4
Figure 4
IL-SEM of Pt/Vulcan 3–4 nm (green), Pt@HGS 1–2 nm (blue) and Pt@HGS 3–4 nm (red) after 0 (top) and after 3600 (bottom) potential cycles between 0.4 and 1.4 VRHE in 0.1 M HClO4 at a scan rate of 1 V·s−1. IL-SEM visualizes the surface morphology of the materials, in particular the support structure, which is demonstrated not to undergo significant changes during potential cycling at room temperature.
Figure 5
Figure 5
Identical location dark field IL-STEM of Pt/Vulcan 3–4 nm (green), Pt@HGS 1–2 nm (blue) and Pt@HGS 3–4 nm (red) after 0 (top) and after 3600 (middle) potential cycles between 0.4 and 1.4 VRHE in 0.1 M HClO4 at a scan rate of 1 V·s−1 at room temperature. The insets highlight sub-regions in the micrograph. The yellow circles for the Pt@HGS 1–2 nm material mark several particles which result from untypical, strong particle growth. The change in particle size distribution for all three Pt/C materials is additionally depicted at the bottom. Bars referring to the same particle diameter before (filled) and after degradation (shaded) are pictured next to each other.
Figure 6
Figure 6
IL-TEM micrographs of Pt/Vulcan 3–4 nm after 0 and after 3600 potential cycles between 0.4 and 1.4 VRHE in 0.1 M HClO4 (scan rate 1 V·s−1, room temperature). Blue, red and green symbols mark dissolving, detached and coalescing platinum particles.
Figure 7
Figure 7
IL-TEM micrographs of the Pt/Vulcan 3–4 nm catalyst before and after 5000 potential cycles between 0.4 and 1.4 VRHE in 0.1 M HClO4 (scan rate 1 V·s−1, room temperature). Green circles indicate examples for agglomeration of platinum nanoparticles. The particle size distributions before and after 5000 degradation cycles indicate both particle growth and dissolution to occur. Bars referring to the same particle diameter before (filled) and after degradation (shaded) are pictured next to each other.
Figure 8
Figure 8
IL-TEM micrographs of the Pt@HGS 3–4 nm catalyst before and after 5000 potential cycles between 0.4 and 1.4 VRHE in 0.1 M HClO4 (scan rate 1 V·s−1, room temperature). The red rectangles in the micrographs mark regions, which are magnified on the right. Filled bars refer to the particle size before, shaded bars to the particle size after degradation.
Figure 9
Figure 9
IL-TEM micrographs from degradation studies on four Pt/C fuel cell catalysts. Pt/C 5 nm (A,B) and Pt/C 3nm (C,D) are the same catalysts as depicted in Table 1 and Figure 2. Pt/graph-C (E,F) is a catalyst with graphitized carbon support and Pt/LSA-C II (G,H) is a catalyst with a (transition-metal modified) low surface area support. More information about these and further catalysts can be found in Table 2. A), C), E) and G) depict the catalysts before potential cycling, while B), D), F) and H) are micrographs of the identical locations after 3600 potential cycles between 0.4 and 1.4 VRHE (scan rate 1 V·s−1; 0.1 M HClO4, room temperature). A) and B) were reprinted from [52] with permission; Copyright 2008 Elsevier. C)–F) were reproduced from [67] with permission; Copyright 2012 The Electrochemical Society. G) and H) were kindly provided by Arenz and co-workers.
Figure 10
Figure 10
IL-TEM micrograph of Pt/C 5 nm subjected to 1.3 VRHE at 348 K (75 °C) for 16 h in 0.1 M HClO4. A shrinkage of the carbon support due to carbon corrosion with successive decrease in inter-particle distances and coalescence can be observed. The images were reprinted with permission from [49]. Copyright 2011 Elsevier.
Figure 11
Figure 11
A) Dependence of the AID on platinum content for various platinum particle sizes, calculated for a Vulcan support (BET ca. 250 m2·g−1) using Equation 1. B) Dependence of the AID on platinum content for various specific support surface areas, calculated for a platinum particle diameter of 3 nm, by using Equation 1.
Figure 12
Figure 12
Impact of catalyst particle size and post-synthesis heat treatment on the normalized platinum surface area loss. The test was performed with H2 on the anode and N2 on the cathode at 80 °C, 100% RH. The cathode side of the membrane electrode assembly (MEA) is cycled between 0.6 and 1.0 VRHE at 0.02 V·s−1. The graph was reproduced from [81] with permission. Copyright 2006 The Electrochemical Society.

References

    1. Debe M K. Nature. 2012;486:43–51. doi: 10.1038/nature11115. - DOI - PubMed
    1. Marković N M, Ross P N., Jr Surf Sci Rep. 2002;45:117–229. doi: 10.1016/S0167-5729(01)00022-X. - DOI
    1. Borup R, Meyers J, Pivovar B, Kim Y S, Mukundan R, Garland N, Myers D, Wilson M, Garzon F, Wood D, et al. Chem Rev. 2007;107:3904–3951. doi: 10.1021/cr050182l. - DOI - PubMed
    1. Gasteiger H A, Kocha S S, Sompalli B, Wagner F T. Appl Catal, B. 2005;56:9–35. doi: 10.1016/j.apcatb.2004.06.021. - DOI
    1. Greeley J, Stephens I E L, Bondarenko A S, Johansson T P, Hansen H A, Jaramillo T F, Rossmeisl J, Chorkendorff I, Nørskov J K. Nat Chem. 2009;1:552–556. doi: 10.1038/nchem.367. - DOI - PubMed