. 2014 Apr;28(4):512-24.
doi: 10.1210/me.2013-1401. Epub 2014 Feb 25.

Adiponectin inhibits insulin function in primary trophoblasts by PPARα-mediated ceramide synthesis

Affiliations

Adiponectin inhibits insulin function in primary trophoblasts by PPARα-mediated ceramide synthesis

Irving L M H Aye et al. Mol Endocrinol. 2014 Apr.

Abstract

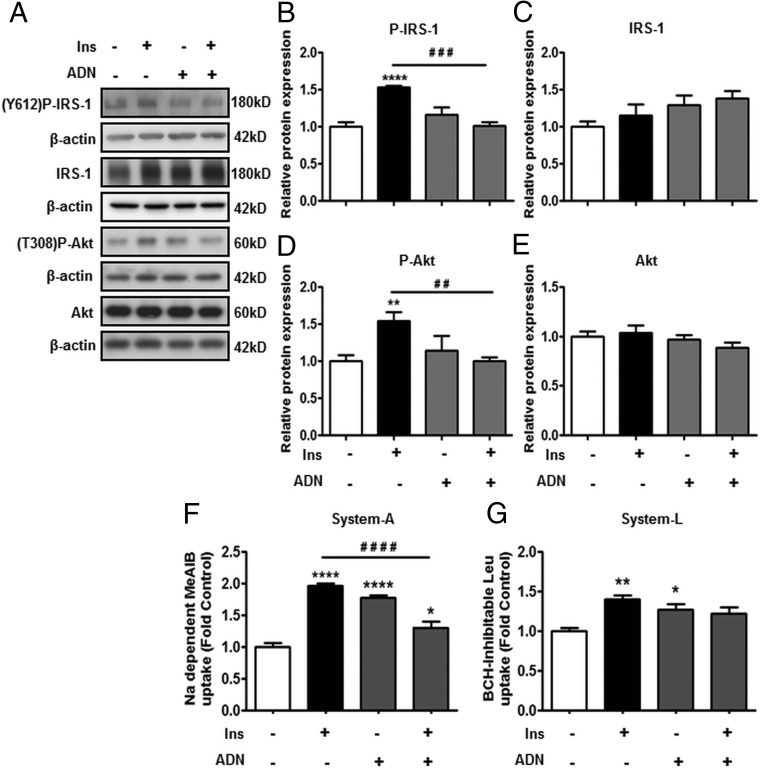
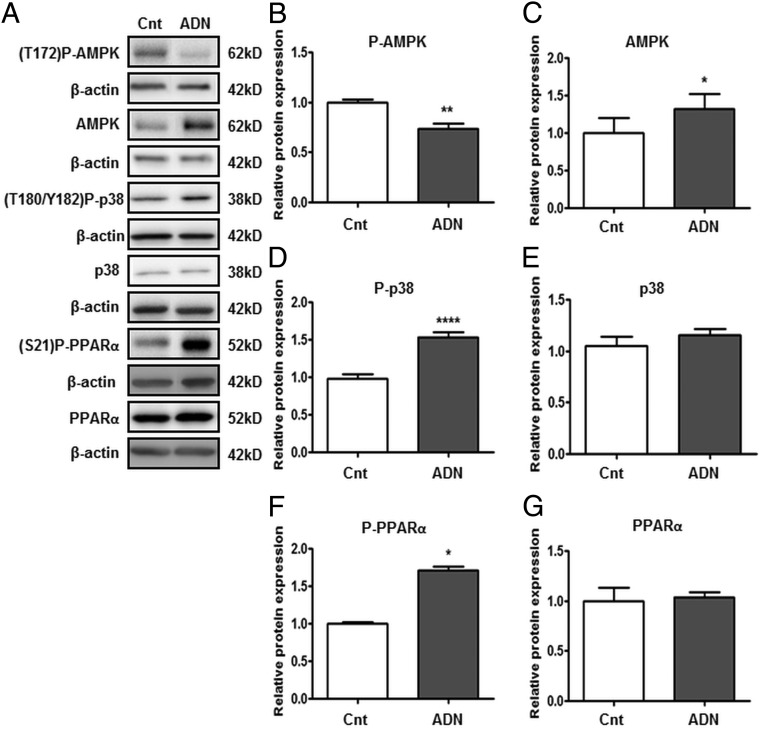
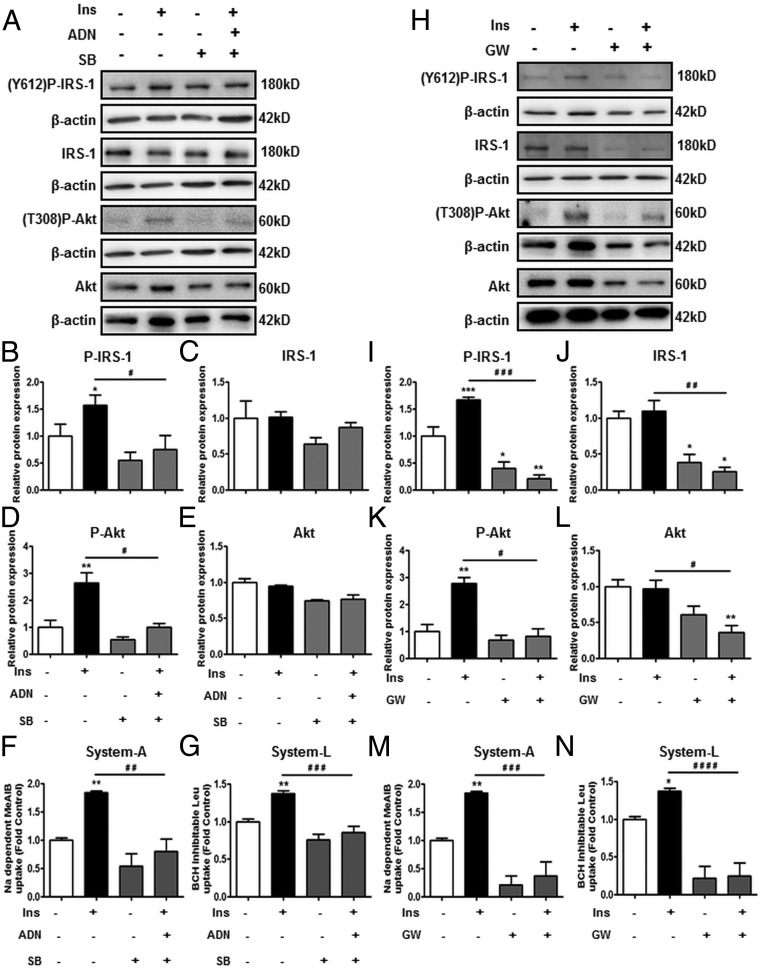
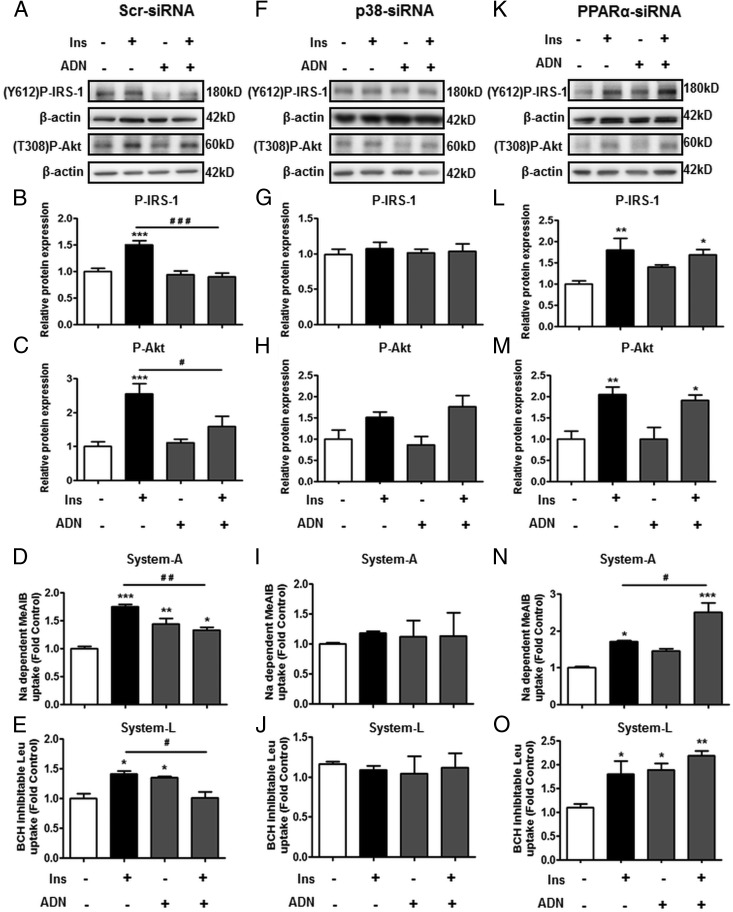
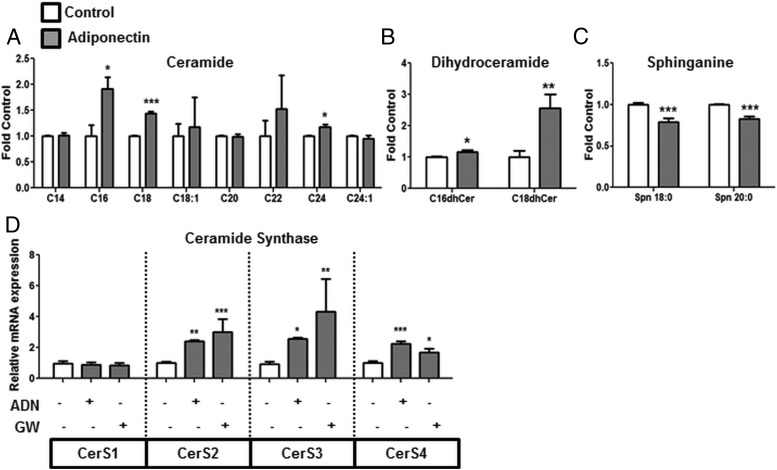
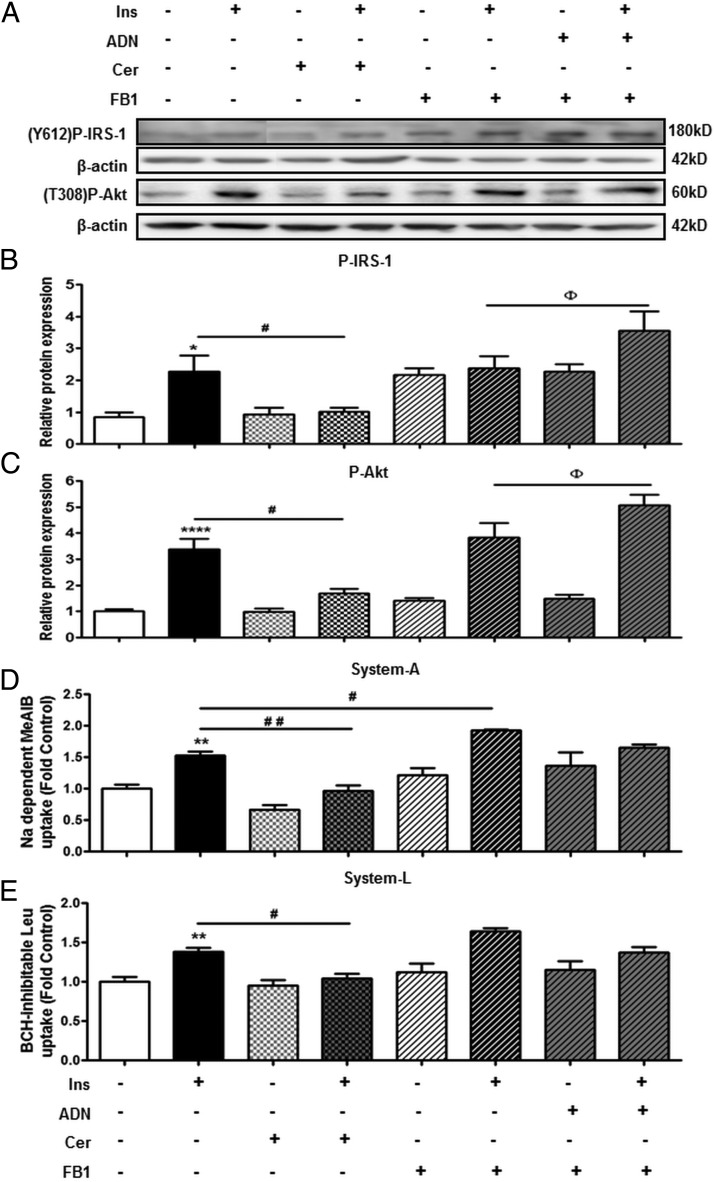
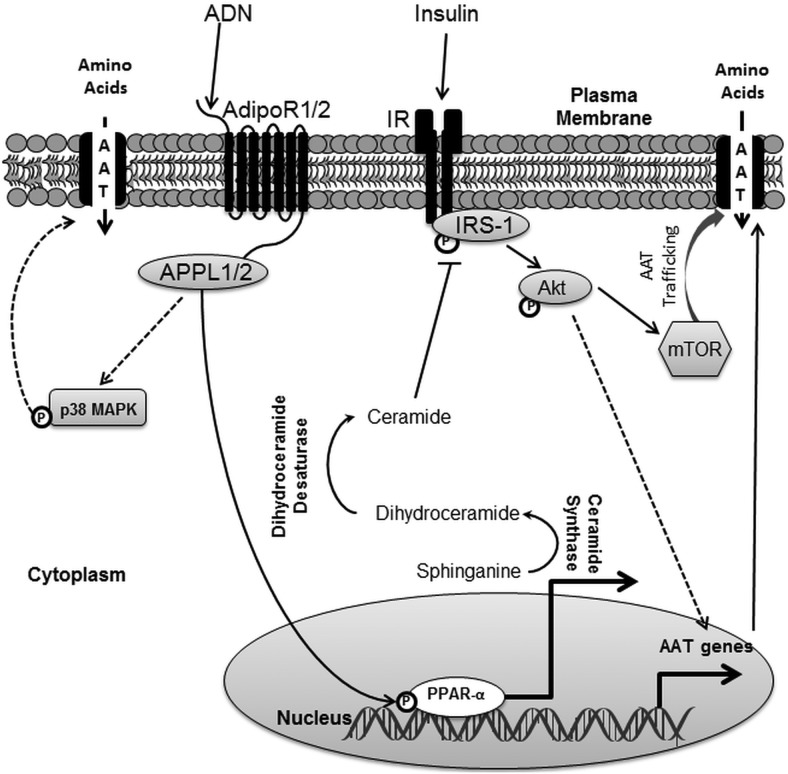
Maternal adiponectin (ADN) levels are inversely correlated with birth weight, and ADN infusion in pregnant mice down-regulates placental nutrient transporters and decreases fetal growth. In contrast to the insulin-sensitizing effects in adipose tissue and muscle, ADN inhibits insulin signaling in the placenta. However, the molecular mechanisms involved are unknown. We hypothesized that ADN inhibits insulin signaling and insulin-stimulated amino acid transport in primary human trophoblasts by peroxisome proliferator-activated receptor-α (PPARα)-mediated ceramide synthesis. Primary human term trophoblast cells were treated with ADN and/or insulin. ADN increased the phosphorylation of p38 MAPK and PPARα. ADN inhibited insulin signaling and insulin-stimulated amino acid transport. This effect was dependent on PPARα, because activation of PPARα with an agonist (GW7647) inhibited insulin signaling and function, whereas PPARα-small interfering RNA reversed the effects of ADN on the insulin response. ADN increased ceramide synthase expression and stimulated ceramide production. C2-ceramide inhibited insulin signaling and function, whereas inhibition of ceramide synthase (with Fumonisin B1) reversed the effects of ADN on insulin signaling and amino acid transport. These findings are consistent with the model that maternal ADN limits fetal growth mediated by activation of placental PPARα and ceramide synthesis, which inhibits placental insulin signaling and amino acid transport, resulting in reduced fetal nutrient availability.


Figures

Figure 1.
Figure 1.
ADN inhibits insulin (Ins) signaling and insulin-stimulated amino acid transport. PHT cells were incubated with Ins (5.8 ng/mL), ADN (5 μg/mL), or Ins (5.8 ng/mL) + ADN (5 μg/mL), and protein lysates were examined by immunoblotting or systems A and L amino acid transport activity was measured. A, Representative immunoblots of P-IRS-1 (Y612), IRS-1, P-Akt (T308), Akt, and β-actin. Histograms illustrate relative protein expression of (B) phosphorylated IRS-1 (Y612), (C) IRS-1, (D) phosphorylated Akt (T308), and (E) Akt. F, system A activity was determined as sodium-dependent methyl-aminoisobutyric acid uptake and (G) system L activity by BCH-inhibitable leucine uptake. Data represent fold change from vehicle control (PBS, 0.1% vol/vol). Mean + SEM, n = 6 (cell signaling), n = 4 (amino acid transport); one-way ANOVA; *, P < .05; **, P < .01; ****, P < .0001 vs Cnt; or # #, P < .01; # # #, P < .001; # # # #, P < .0001 vs Ins. Ins, insulin; Y612, tyrosine 612; T308, threonine 308.
Figure 2.
Figure 2.
Influence of ADN on AMPK, p38 MAPK, and PPARα signaling pathways. PHT cells were incubated with ADN (5 μg/mL) and protein lysates were examined by immunoblotting analyses. A, Representative immunoblots of P-AMPK (T172), AMPK, P-p38 (T180/Y182), p38, P-PPARα (Ser21), PPARα, and β-actin. Histograms illustrate relative protein expression of (B) phosphorylated AMPK (T172), (C) AMPK, (D) phosphorylated p38 (T180/Y182), (E) p38, (F) phosphorylated PPARα (Ser21), and (G) PPARα. Data represent fold change from vehicle control (dimethylsulfoxide [DMSO], 0.1% vol/vol). Mean + SEM, n = 6; Student's t test; *, P < .05; **, P < .01; ****, P < .0001 vs control (Cnt).
Figure 3.
Figure 3.
The role of p38 MAPK and PPARα in mediating the effect of ADN on insulin (Ins) signaling and insulin-stimulated amino acid transport targeting by pharmacologic agents. In panels A–G, PHT cells were treated with Ins (5.8 ng/mL), p38 MAPK antagonist SB (20 μM) with/without Ins (5.8 ng/mL) + ADN (5 μg/mL). Panels H–N show PHT cells treated with PPARα agonist GW (0.1 μM) with/without Ins (5.8 ng/mL). A and H, Representative immunoblots of P-IRS-1 (Y612), IRS-1, P-Akt (T308), Akt, and β-actin. Histograms illustrate relative protein expression of (B and I) phosphorylated IRS-1 (Y612), (C and J) IRS-1, (D and K) phosphorylated Akt (T308), (E and L) Akt, and (F and M) system A and (G and N) system L amino acid transport activity. Data represent fold change from vehicle control (dimethylsulfoxide [DMSO], 0.1% vol/vol). Mean + SEM, n = 4 (cell signaling); n = 5 (amino acid transport); one-way ANOVA; *, P < .05; **, P < .01; ***, P < .001 vs Cnt; or #, P < .05; # #, P < .01; # # #, P < .001; # # # #, P < .0001 vs Ins. Ins, insulin; Y612, tyrosine 612; T308, threonine 308.
Figure 4.
Figure 4.
The role of p38 MAPK and PPARα in mediating the effect of ADN on insulin signaling and insulin-stimulated amino acid transport targeting by siRNA. PHTs were transfected with (A–E) nontargeting scramble-siRNA (F–J) p38-siRNA or (K–O) PPARα-siRNA, and then stimulated with Ins (5.8 ng/mL), ADN (5 μg/mL), or Ins (5.8 ng/mL) + ADN (5 μg/mL) as described in Materials and Methods. A, F, and K, Representative immunoblots of P-IRS-1 (Y612), P-Akt (T308), and β-actin. Histograms illustrate relative protein expression of (B, G, and L) phosphorylated IRS-1 (Y612) and (C, H, and M) phosphorylated Akt (T308) and (D, I, and N) system A and (E, J, and O) system L amino acid transport activity. Data represent fold change from vehicle control (PBS, 0.1% vol/vol). Mean + SEM, n = 5 (cell signaling), n = 4 (amino acid transport); one-way ANOVA; *, P < .05; **, P < .01; ***, P < .001 vs Cnt or #, P < .05; # #, P < .01; # # #, P < .001 vs Ins. Ins, insulin; Y612, tyrosine 612; T308, threonine 308. Scr siRNA, scramble siRNA.
Figure 5.
Figure 5.
ADN increases the expression of CerS and promotes ceramide biosynthesis. PHT cells were incubated with ADN (5 μg/mL), and lipids were extracted for HPLC-ESI-MS/MS analysis. ADN treatment is associated with alterations in cellular levels of long chain (A) ceramide, (B) dihydroceramide, and (C) sphinganine. Target lipid concentrations were normalized against total lipids and expressed as fold change from vehicle control (PBS, 0.1% vol/vol). Mean + SEM, n = 5. Student's t test; *, P < .05; **, P < .01; ***, P < .001 vs Cnt. D, mRNA expression of CerS1–4 was analyzed by Q-PCR following ADN and GW treatment. Mean + SEM, n = 4; one-way ANOVA; *, P < .05; **, P < .01; ***, P < .001 vs control (Cnt).
Figure 6.
Figure 6.
The role of ceramide in mediating the effect of ADN on insulin signaling and insulin-stimulated amino acid transport. Solid filled bars represent PHTs treated with Ins (5.8 ng/mL) or vehicle control. Checkered bars illustrate PHTs treated with cell- permeable C2-Cer (10 μM) with/without Ins (5.8 ng/mL). Striped bars indicate PHTs incubated with FB1 (50 μM) prior to stimulation with Ins (5.8 ng/mL), ADN (5 μg/mL), or Ins (5.8 ng/mL) + ADN (5 μg/mL). A, Representative immunoblots of P-IRS-1 (Y612), P-Akt (T308), and β-actin. Histograms illustrate relative protein expression of (B) phosphorylated IRS-1 (Y612) and (C) phosphorylated Akt (T308) and (D) system A and (E) system L amino acid transport activity. Data represent fold change from vehicle control (BSA, 0.1% vol/vol). Mean + SEM, n = 5 (cell signaling and amino acid transport); one-way ANOVA; *, P < .05; **, P < .01; ****, P < .0001 vs Cnt; #, P < .05; # #, P < .01; # # #, P < .0001 vs Ins; or Φ, P < .05 vs Ins + FB1. Ins, insulin; Cer, C2-ceramide; Y612, tyrosine 612; T308, threonine 308.
Figure 7.
Figure 7.
Model of ADN-mediated inhibition of insulin signaling and function. ADN activates p38 MAPK and PPARa. ADN activation of p38 MAPK is associated with increased amino acid uptake. PPARa activation by ADN leads to increased conversion of sphinganine to dihydroceramide mediated by ceramide synthase. Dihydroceramide is then further reduced to ceramide, which inhibits IRS-1 and subsequently Akt. Inhibition of insulin signaling by ADN is associated with attenuation of insulin stimulated systems A and L amino acid transport, which is known to be mediated by increased expression of amino acid transporter genes and trafficking of amino acid transporters to the plasma membrane via mTOR. AAT, amino acid transporters; mTOR, mechanistic target of rapamycin.

References

    1. Yu Z, Han S, Zhu J, Sun X, Ji C, Guo X. Pre-pregnancy body mass index in relation to infant birth weight and offspring overweight/obesity: a systematic review and meta-analysis. PloS One. 2013;8(4):e61627. - PMC - PubMed
    1. Marshall NE, Guild C, Cheng YW, Caughey AB, Halloran DR. The effect of maternal body mass index on perinatal outcomes in women with diabetes. Am J Perinatol. 2014;31(3)249–256. - PMC - PubMed
    1. Catalano PM, Presley L, Minium J, Hauguel-de Mouzon S. Fetuses of obese mothers develop insulin resistance in utero. Diabetes Care. 2009;32(6):1076–1080. - PMC - PubMed
    1. Boney CM, Verma A, Tucker R, Vohr BR. Metabolic syndrome in childhood: association with birth weight, maternal obesity, and gestational diabetes mellitus. Pediatrics. 2005;115(3):e290–296. - PubMed
    1. Gaccioli F, Lager S, Powell TL, Jansson T. Placental transport in response to altered maternal nutrition. J Dev Origins HealthDis. 2013;4(2):101–115. - PMC - PubMed

Publication types

MeSH terms