. 2014 Mar 4;19(3):393-406.
doi: 10.1016/j.cmet.2014.01.019.

Cholesteryl ester accumulation induced by PTEN loss and PI3K/AKT activation underlies human prostate cancer aggressiveness

Affiliations

Cholesteryl ester accumulation induced by PTEN loss and PI3K/AKT activation underlies human prostate cancer aggressiveness

Shuhua Yue et al. Cell Metab. .

Abstract

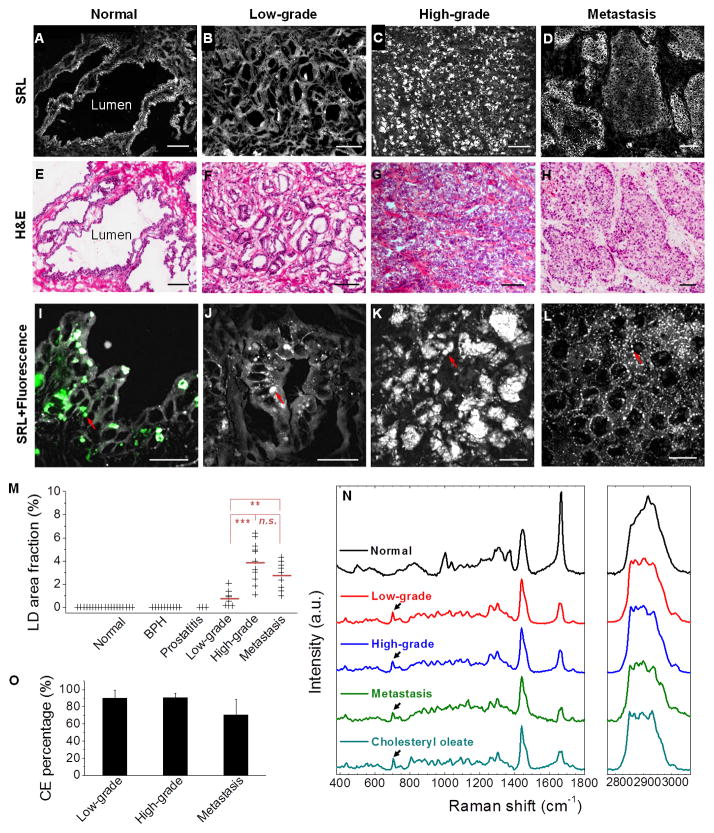
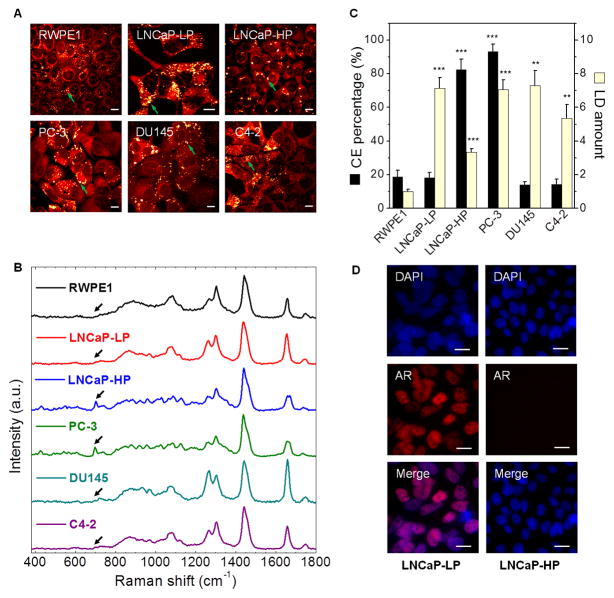
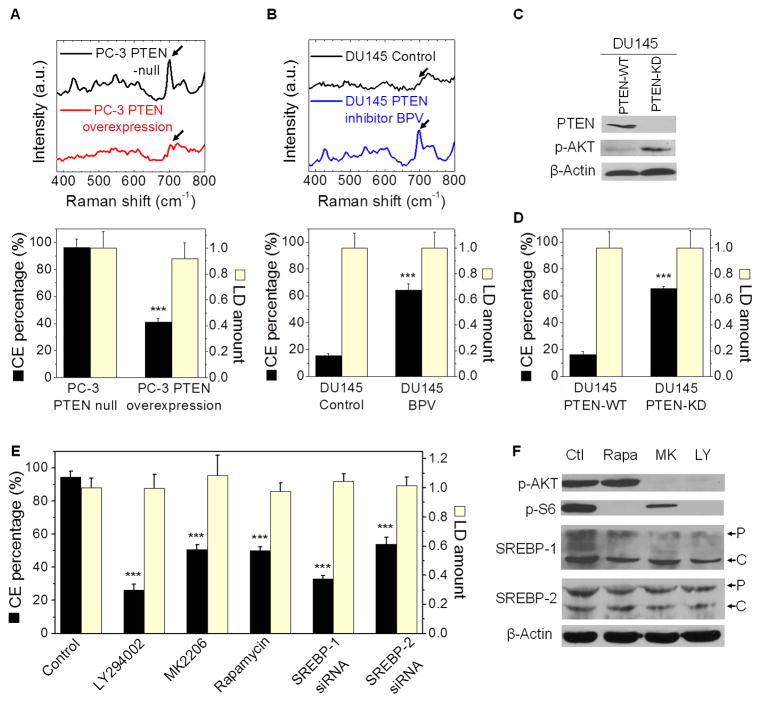
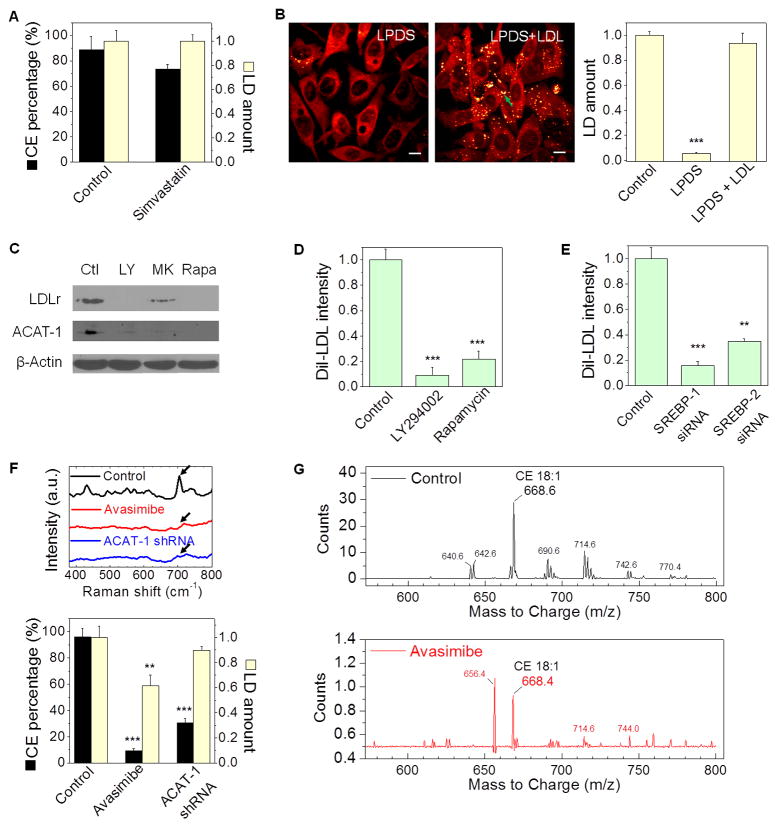
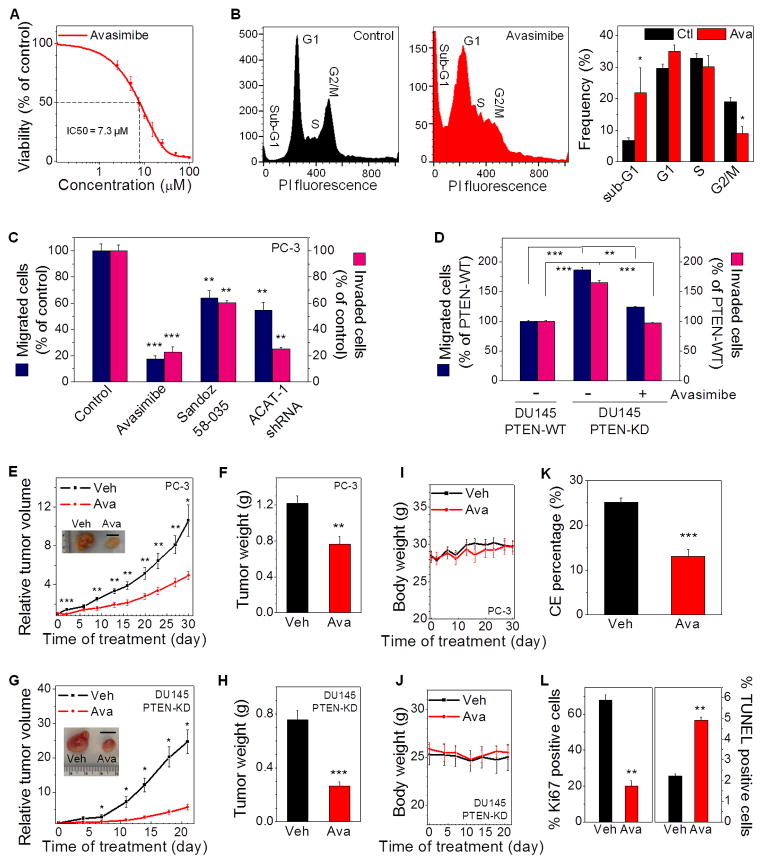
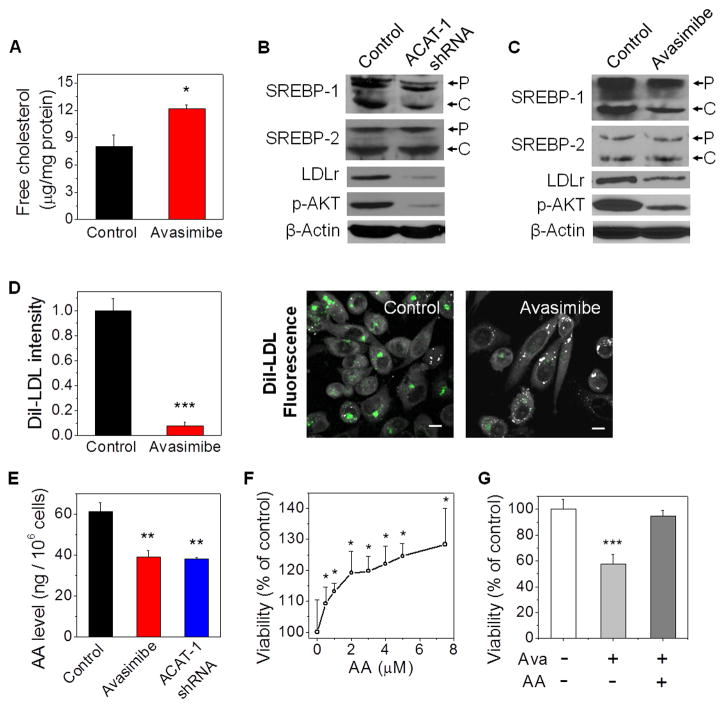
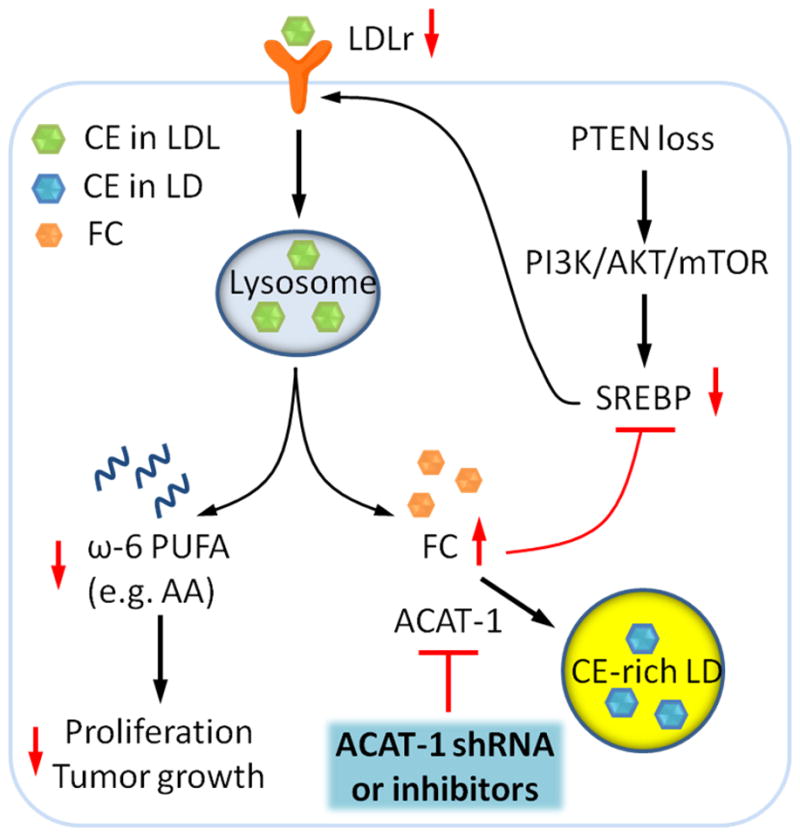
Altered lipid metabolism is increasingly recognized as a signature of cancer cells. Enabled by label-free Raman spectromicroscopy, we performed quantitative analysis of lipogenesis at single-cell level in human patient cancerous tissues. Our imaging data revealed an unexpected, aberrant accumulation of esterified cholesterol in lipid droplets of high-grade prostate cancer and metastases. Biochemical study showed that such cholesteryl ester accumulation was a consequence of loss of tumor suppressor PTEN and subsequent activation of PI3K/AKT pathway in prostate cancer cells. Furthermore, we found that such accumulation arose from significantly enhanced uptake of exogenous lipoproteins and required cholesterol esterification. Depletion of cholesteryl ester storage significantly reduced cancer proliferation, impaired cancer invasion capability, and suppressed tumor growth in mouse xenograft models with negligible toxicity. These findings open opportunities for diagnosing and treating prostate cancer by targeting the altered cholesterol metabolism.


Figures

Figure 1
Figure 1. Aberrant CE accumulation in human PCa tissues
(A–D) Large-area SRL images and benign prostate, low-grade PCa (Gleason grade 3), high-grade PCa (Gleason grade 4), and metastatic PCa (liver), respectively. (E–H) Hematoxylin and eosin (H&E) staining of the adjacent slices. Scalar bar, 100 μm. (I–L) High magnification SRL and two-photon fluorescence images of the lesions shown in (A-D) (grey: SRL, green: two-photon fluorescence). Autofluorescent granules and LDs indicated by red arrows. Scalar bar, 20 μm. (M) LD area fraction in 19 normal prostate, 10 BPH, 3 prostatitis, 9 low-grade PCa, 11 high-grade PCa, and 9 metastatic PCa. Mean of LD area fraction indicated by red line. n.s., not significant. (N) Raman spectra of autofluorescent granules in normal prostate, LDs in PCa, and pure cholesteryl oleate. Spectral intensity was normalized by CH2 bending band at 1442 cm−1. Black arrows indicate the bands of cholesterol rings at 702 cm−1. (O) CE molar percentage in LDs of low-grade PCa (n = 9), high-grade PCa (n = 11), and metastatic PCa (n = 9). Error bars represent SD.
Figure 2
Figure 2. CE accumulation is not correlated with androgen signaling
(A) SRL images of various types of cells, including RWPE1, LNCaP-LP, LNCaP-HP, PC-3, DU145, and C4-2. LDs indicated by green arrows. (B) Raman spectra of LDs in cells shown in (A). Spectral intensity was normalized by the peak at 1442 cm−1. Black arrows indicate the bands of cholesterol rings at 702 cm−1. (C) Quantitation of LD amount and CE percentage. LD amount was normalized by the RWPE1 group. Error bars represent SEM. n > 5. **: p < 0.005, ***: p < 0.0005. (D) Nuclear translocation of androgen receptor (AR) in LNCaP-LP and LNCaP-HP cells. Blue: DAPI, Red: AR immunofluorescence. Scalar bar, 10 μm.
Figure 3
Figure 3. CE accumulation is induced by PTEN loss and PI3K/AKT activation
(A) Raman spectra of LDs in PTEN-null and PTEN-overexpressed PC-3 cells (3 day transfection) are shown. The band of cholesterol rings at 702 cm−1 nearly disappeared after the treatment, as indicated by the arrows. Quantitation of CE percentage and LD amount is shown below the spectra. n > 5. (B) CE levels in DU145 cell treated with PTEN inhibitor BPV (10 μM) for 3 days. Raman spectra of LDs in control and treated cells are shown. The band of cholesterol rings at 702 cm−1 significantly increased after the treatment, as indicated by the arrows. Quantitation of CE percentage and LD amount is shown below the spectra. n > 5. Spectral intensity was normalized by the peak at 1442 cm−1 in (A, B). (C) Immunoblot of antibodies against PTEN, p-AKT, and β-Actin in PTEN-WT and PTEN-KD DU145 cells. (D) CE percentage and LD amount in PTEN-WT and PTEN-KD DU145 cells. (E) CE percentage and LD amount in cells treated with DMSO as control, LY294002 (50 μM, 3 day), MK2206 (10 μM, 2 day), rapamycin (100 nM, 2 day), and SREBP-1 and -2 siRNA (2 day transfection). n > 5. LD amount was normalized by the control group in (A, B, D, E). (F) Immunoblot of antibodies against p-AKT, p-S6, SREBP-1 and -2, and β-Actin in PC-3 cells treated with DMSO as control (Ctl), LY294002 (LY), MY2206 (MK), and rapamycin (Rapa). P: precursor form, C: cleaved form. The expression levels of p-AKT and p-S6 were reduced after inhibitor treatments as expected. WT: wild-type, KD: knockdown. Error bars represent SEM. ***: p < 0.0005.
Figure 4
Figure 4. CE accumulation arises from enhanced uptake of LDL and involves cholesterol esterification by ACAT-1
(A) LD amount and CE percentage in PC-3 cells treated with or without simvastatin (10 μM, 1 day), n > 5. (B) SRL images and quantitation of LD amount in PC-3 cells treated with lipoprotein deficient serum (LPDS, 10%, 1 day) and subsequent LDL re-addition (45 μg/ml, 1 day), n = 6. LDs indicated by the green arrow. (C) Immunoblot of antibodies against LDLr, ACAT-1, and β-Actin in PC-3 cells treated with DMSO as control (Ctl), LY294002 (LY, 50 μM, 3 day), MK2206 (MK, 10 μM, 2 day), and rapamycin (Rapa, 100 nM, 2 day). (D, E) Quantitation of DiI-LDL uptake by PC-3 cells treated with DMSO as control, LY294002, and rapamycin (n = 5) (D), and transfected with SREBP-1 or -2 siRNA (n = 5) (E). DiI-LDL intensity was normalized by the control group. (F) Raman spectra of LDs and quantitation of LD amount and CE percentage in PC-3 cells treated with avasimibe (7.5 μM, 1 day) and ACAT-1 shRNA (3 day transfection). n > 5. Spectral intensity was normalized by the peak at 1442 cm−1. The bands of cholesterol rings at 702 cm−1 nearly disappeared after the treatments, as indicated by the arrows. LD amount was normalized by the control group in (A, B, F). (G) Mass spectra of lipids extracted from control and avasimibe-treated PC-3 cells (7.5 μM, 2 day). The m/z 668 peak stands for cholesteryl oleate (CE 18:1). DiI-LDL: DiI-labeled LDL. Error bars represent SEM. **: p < 0.005, ***: p < 0.0005. Scalar bar, 10 μm.
Figure 5
Figure 5. CE depletion impairs PCa aggressiveness
(A) IC50 curve of avasimibe treatments (3 day) on PC-3 cells (IC50 = 7.3 μM). n = 6. The control group (DMSO) was used for normalization. (B) Flow cytometry analysis of cell cycle in control and avasimibe-treated (7.5 μM, 3 day) PC-3 cells (n = 3). PI: propidium iodide. (C) Quantitation of migrated and invaded PC-3 cells that were pretreated with avasimibe (5 μM), Sandoz 58-035 (10 μM), or ACAT-1 shRNA for 2 days (n = 3). The control group was used for normalization. (D) Quantitation of migrated and invaded PTEN-WT or PTEN-KD DU145 cells that were pretreated with DMSO as control or avasimibe (5 μM) for 1 day (n = 3). The PTEN-WT DU145 group was used for normalization. (E) Relative tumor volume of PC-3 xenograft (n = 9) upon daily avasimibe treatments (15 mg/kg). Representative tumors harvested on day 30 are shown in the inset. Scalar bar, 1 cm. (F) Weight of tumor tissues harvested from vehicle and avasimibe-treated mice in (E). (G) Relative tumor volume of PTEN-KD DU145 xenograft (n = 8). Representative tumors harvested on day 21 are shown in the inset. Scalar bar, 1 cm. (H) Weight of tumor tissues harvested from vehicle and avasimibe-treated mice in (G). (I, J) Body weight of the mice bearing PC-3 tumors (n = 9) (I), and PTEN-KD DU145 tumors (n = 8) (J). (K) CE percentage and (L) Percentage of Ki67 and TUNEL positive cells in tumor tissues harvested from vehicle and avasimibe-treated mice in (E) (n = 5). Ctl: control, Veh: vehicle, Ava: avasimibe, WT: wild-type, KD: knockdown. Error bars represent SEM. *: p < 0.05, **: p < 0.005, ***: p < 0.0005.
Figure 6
Figure 6. CE depletion reduces PCa cell proliferation by limiting the uptake of essential fatty acids
(A) Free cholesterol level in control and avasimibe-treated PC-3 cells (n = 3). (B, C) Immunoblot of antibodies against SREBP-1 and -2, LDLr, p-AKT, and β-Actin in PC-3 cells treated with ACAT-1 shRNA (B) or avasimibe (C). P: precursor form, C: cleaved form. (D) Quantitation and representative images and of DiI-LDL uptake in control and avasimibe-treated PC-3 cells (n = 5). Grey: SRL; Green: two-photon fluorescence. Scalar bar, 10 μm. DiI-LDL intensity was normalized by the control group. (E) AA levels in PC-3 cells treated with avasimibe or ACAT-1 shRNA (n = 3). In (A-E), avasimibe treatment: 7.5 μM, 2 day, ACAT-1 shRNA: 3 day transfection. (F) Dose-dependent growth of PC-3 cells upon AA treatments (3 day). (G) PC-3 cell viability upon avasimibe treatment (7.5 μM) in the absence or presence of AA (7.5 μM) for 3 day. The control groups were used for normalization. AA: arachidonic acid, Ava: avasimibe. Error bars represent SEM. *: p < 0.05, **: p < 0.005, ***: p < 0.0005.
Figure 7
Figure 7. Molecular pathways underlying accumulation of CE in advanced human PCa and suppression of cancer proliferation upon CE depletion
The schematic shows that loss of PTEN activates PI3K/AKT/mTOR pathway, which in turn upregulates SREBP and LDLr. LDL is then hydrolyzed to free fatty acids and free cholesterol (FC) in lysosome. The excess FC together with the fatty acyl CoA substrate is converted to CE by ACAT-1 and stored in LDs. LDL also serves as an important carrier of ω-6 polyunsaturated fatty acid (PUFA), such as AA, which promotes cell proliferation and tumor growth. The red arrows depict the consequences of CE depletion. Depletion of CE storage by ACAT-1 knockdown or ACAT inhibition disturbs cholesterol homeostasis by elevating FC levels and consequently downregulating expression levels of SREBP and LDLr. Subsequently reduced uptake of ω-6 PUFA from LDL suppresses cancer proliferation.

Comment in

References

    1. Ablin RJ, Guinan P, Bush IM. Lipofuscin granules in normal, benign and malignant human prostatic tissue. Urol Res. 1973;1:149–151. - PubMed
    1. Accioly MT, Pacheco P, Maya-Monteiro CM, Carrossini N, Robbs BK, Oliveira SS, Kaufmann C, Morgado-Diaz JA, Bozza PT, Viola JPB. Lipid bodies are reservoirs of cyclooxygenase-2 and sites of prostaglandin-E2 synthesis in colon cancer cells. Cancer Res. 2008;68:1732–1740. - PubMed
    1. Antalis C, Arnold T, Rasool T, Lee B, Buhman K, Siddiqui R. High ACAT1 expression in estrogen receptor negative basal-like breast cancer cells is associated with LDL-induced proliferation. Breast Cancer Res Treat. 2009;122:661–670. - PubMed
    1. Bemlih S, Poirier MD, Andaloussi AE. Acyl-coenzyme A: Cholesterol acyltransferase inhibitor Avasimibe affect survival and proliferation of glioma tumor cell lines. Cancer Biol Ther. 2010;9:1025–1032. - PubMed
    1. Brown MS, Goldstein JL. The SREBP pathway: regulation of cholesterol metabolism by proteolysis of a membrane-bound transcription factor. Cell. 1997;89:331–340. - PubMed

Publication types

MeSH terms