. 2014 Mar 4;19(3):418-30.
doi: 10.1016/j.cmet.2014.02.009.

The ratio of macronutrients, not caloric intake, dictates cardiometabolic health, aging, and longevity in ad libitum-fed mice

Affiliations

The ratio of macronutrients, not caloric intake, dictates cardiometabolic health, aging, and longevity in ad libitum-fed mice

Samantha M Solon-Biet et al. Cell Metab. .

Erratum in

Abstract

The fundamental questions of what represents a macronutritionally balanced diet and how this maintains health and longevity remain unanswered. Here, the Geometric Framework, a state-space nutritional modeling method, was used to measure interactive effects of dietary energy, protein, fat, and carbohydrate on food intake, cardiometabolic phenotype, and longevity in mice fed one of 25 diets ad libitum. Food intake was regulated primarily by protein and carbohydrate content. Longevity and health were optimized when protein was replaced with carbohydrate to limit compensatory feeding for protein and suppress protein intake. These consequences are associated with hepatic mammalian target of rapamycin (mTOR) activation and mitochondrial function and, in turn, related to circulating branched-chain amino acids and glucose. Calorie restriction achieved by high-protein diets or dietary dilution had no beneficial effects on lifespan. The results suggest that longevity can be extended in ad libitum-fed animals by manipulating the ratio of macronutrients to inhibit mTOR activation.


Figures

Figure 1
Figure 1. The Effects of Dietary Macronutrients on Food Intake
(A) Response surfaces showing the relationship between dry matter (DM) intake versus macronutrient content of the diet. Surfaces were fitted using generalized additive models (GAMs) with thin-plate splines. Three 2D slices are given to show all three nutrient dimensions (protein, P; carbohydrate, C; fat, F). For each 2D slice, the third factor is at its median (shown below the × axis in parentheses). In all surfaces, red indicates the highest value, while blue indicates the lowest value, with the colors standardized across the three slices. (B) Relationship between protein, carbohydrate, and fat intake versus the proportion of protein, carbohydrate, and fat in the diet relative to the other macronutrients, respectively. A decelerating curve indicates regulation for a given nutrient, with the asymptote reflecting the target intake for that nutrient. (C) Response surfaces showing the relationship between total energy intake versus macronutrient content of the diet. Energy intake was highest on low P:high F and low C:high F diets, presumably because mice overate in an attempt to achieve their protein or carbohydrate targets, with less compensatory suppression of food intake by fat. (D) Relationship between body fat and leptin levels, according to the three energy density diets. See also Figure S2 and Table S3.
Figure 2
Figure 2. The Effects of Dietary Macronutrients and Energy Intake on Longevity
(A) Response surfaces showing the relationship between protein (P), carbohydrate (C), and fat (F) intake versus median lifespan (weeks). For each 2D slice, the third factor is at its median (shown below the × axis in parentheses). In all surfaces, red indicates the highest value, while blue indicates the lowest value, with the colors standardized across the three slices. (B and C) Kaplan-Meier survival curves according to differing dietary protein:carbohydrate ratios (B) and dietary energy density (C). (D) The relationship between the ratio of protein to carbohydrate in the diet and the risk of death. A Cox regression analysis was performed with gender and energy intake as covariates for males (red) and females (green). The bands show the 95% confidence intervals. (E) The relationship between energy intake and the risk of death. A Cox regression analysis was performed with gender and the ratio of dietary protein to carbohydrate as covariates. (F) As for (D), but based on protein:carbohydrate intakes corrected for lean body mass. (G) As for (E), with energy intake corrected for lean body mass. See also Table S4.
Figure 3
Figure 3. Mechanisms for the Relationship between Diet and Longevity
(A) Response surfaces showing the effect of macronutrient intake on the concentration of branched-chain amino acids (BCAAs)at 15 months (μg/ml). For each 2D slice, the third factor is at its median (shown below × axis in parenthesis). (B) BCAAs in relation to dietary P:C ratio. Red curve is a fitted response by a GAM. Shadowed area shows 95% confidence interval of the fit. (C) Response surfaces showing the effect of macronutrient intake on the concentration of insulin (ng/ml) at 15 months. (D) Response surfaces showing the effect of macronutrient intake on mTOR activation (measured as the ratio of phosphorylated mTOR to total mTOR) in the liver at 15 months. (E) Response surface showing the relationship between blood glucose, BCAA, and mTOR activation. The lowest activation state of mTOR is associated with a low ratio (blue line), and the highest activation state is associated with a high ratio (red line). See also Figure S3 and Table S5.
Figure 4
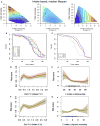
Figure 4. The Effects of Macronutrient Balance on Mitochondrial Function in the Liver
(A) Response surfaces showing the effect of dietary macronutrients on mitochondrial state IVo respiration with pyruvate as substrate (pmol O2 consumed/min/U of citrate synthase) in the liver at 15 months. Surfaces are shown for diet-based data (top), intake-based data (middle), and intake-based data adjusted to lean body mass (bottom). The highest activity is indicated in red (low-protein diets), and the lowest is indicated in blue. (B) Response surfaces showing the effect of dietary macronutrients on mitochondrial state IVo respiration with palmitoyl carnitine as substrate (pmol O2 consumed/min/U of citrate synthase) in the liver at 15 months. Surfaces are shown for diet-based data (top), intake-based data (middle), and intake-based data adjusted to lean body mass (bottom). The highest activity is indicated in red (high-fat diets), and the lowest is indicated in blue. See also Figure S4 and Tables S6 and S7.
Figure 5
Figure 5. The Effects of Macronutrients on Latelife Physical Characteristics and Cardiovascular Physiology
(A–E) Response surfaces show body weight (g) (A), body fat (%) (B), systolic (C) and diastolic blood pressures (mmHg) (D), and representative DEXA scans (E) showing the effect of chronic high P:C and low P:C intakes at 15 months of age. See also Figure S5 and Table S8.
Figure 6
Figure 6. The Effects of Macronutrients on Latelife Metabolic and Bone Parameters
(A–F) Response surfaces show glucose tolerance (incremental area under curve, AUC) (A), HDLc (mmol/l) (B), LDLc (mmol/l) (C), triglycerides (mmol/l) (D), cholesterol (mmol/l) (E), and bone mineral density (g/cm2) (F) at 15 months of age. Low-protein diets were associated with improved glucose tolerance, increased HDLc, and reduced LDLc and cholesterol, all beneficial to the cardiometabolic profile. As expected, triglyceride levels were largely driven by carbohydrate intake. Bone mineral density was adversely affected by both low-protein and low-carbohydrate intakes, being maximal when the combination of protein and carbohydrate intake was high. See also Table S9.

Comment in

References

    1. Bates D, Maechler M, Bolker B. lme4: Linear mixed-effects models using S4 classes. R package version 0.999999-0. 2012 http://cran.r-project.org/web/packages/lme4/index.html.
    1. Blumfield ML, Hure AJ, MacDonald-Wicks LK, Smith R, Simpson SJ, Giles WB, Raubenheimer D, Collins CE. Dietary balance during pregnancy is associated with fetal adiposity and fat distribution. Am J Clin Nutr. 2012;96:1032–1041. - PubMed
    1. Burnett C, Valentini S, Cabreiro F, Goss M, Somogyvári M, Piper MD, Hoddinott M, Sutphin GL, Leko V, McElwee JJ, et al. Absence of effects of Sir2 overexpression on lifespan in C. elegans and Drosophila. Nature. 2011;477:482–485. - PMC - PubMed
    1. Chotechuang N, Azzout-Marniche D, Bos C, Chaumontet C, Gausserès N, Steiler T, Gaudichon C, Tomé D. mTOR, AMPK, and GCN2 coordinate the adaptation of hepatic energy metabolic pathways in response to protein intake in the rat. Am J Physiol Endocrinol Metab. 2009;297:E1313–E1323. - PubMed
    1. Everitt AV, Rattan SI, Le Couteur DG, de Cabo R, editors. Calorie Restriction, Aging and Longevity. New York: Springer Press; 2010.

Publication types

MeSH terms