

Phosphorylation of cMyBP-C affects contractile mechanisms in a site-specific manner
- PMID: 24606935
- PMCID: PMC4026776
- DOI: 10.1016/j.bpj.2014.01.029
Phosphorylation of cMyBP-C affects contractile mechanisms in a site-specific manner
Abstract
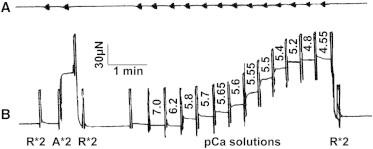
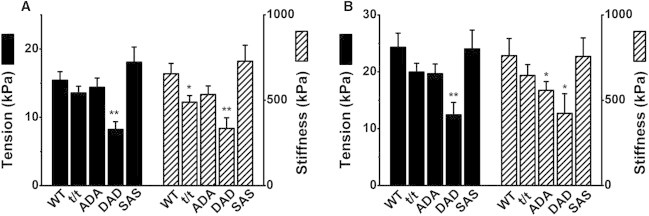
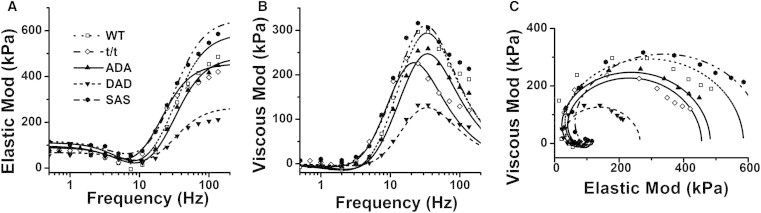
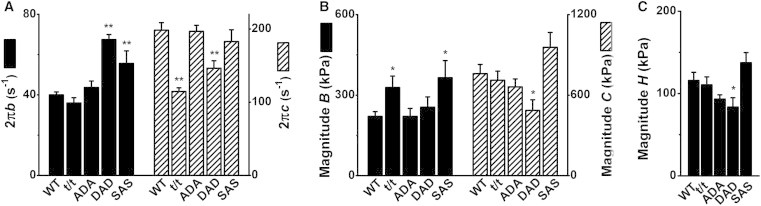
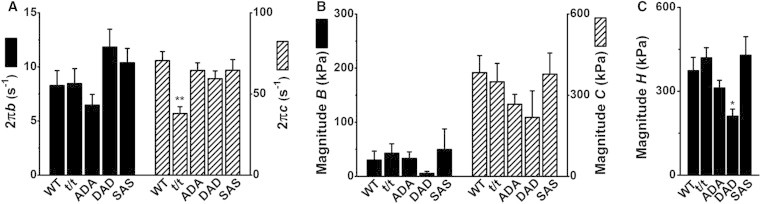
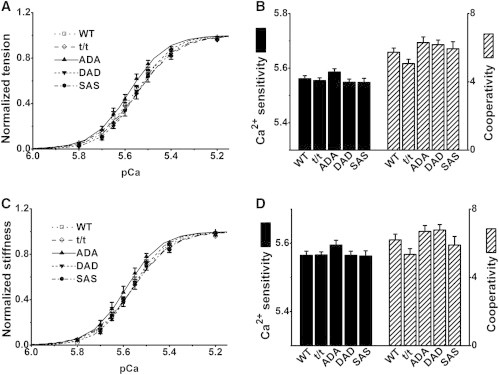
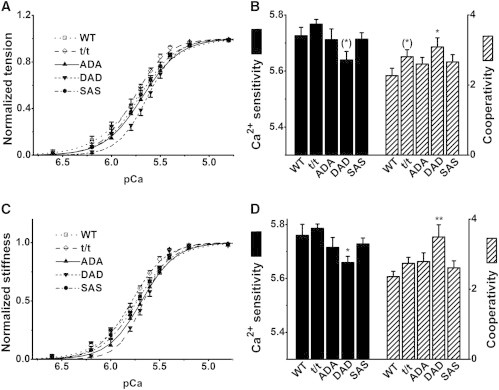
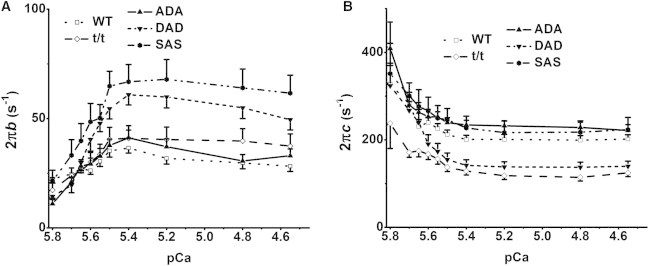
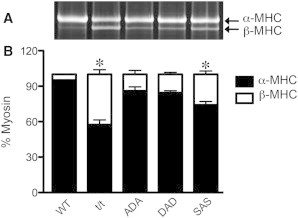
Cardiac myosin binding protein-C (cMyBP-C) is a cardiac-specific, thick-filament regulatory protein that is differentially phosphorylated at Ser(273), Ser(282), and Ser(302) by various kinases and modulates contraction. In this study, phosphorylation-site-specific effects of cMyBP-C on myocardial contractility and cross-bridge kinetics were studied by sinusoidal analysis in papillary and trabecular muscle fibers isolated from t/t (cMyBP-C-null) mice and in their counterparts in which cMyBP-C contains the ADA (Ala(273)-Asp(282)-Ala(302)), DAD (Asp(273)-Ala(282)-Asp(302)), and SAS (Ser(273)-Ala(282)-Ser(302)) mutations; the results were compared to those from mice expressing the wild-type (WT) transgene on the t/t background. Under standard activating conditions, DAD fibers showed significant decreases in tension (~50%), stiffness, the fast apparent rate constant 2πc, and its magnitude C, as well as its magnitude H, but an increase in the medium rate constant 2πb, with respect to WT. The t/t fibers showed a smaller drop in stiffness and a significant decrease in 2πc that can be explained by isoform shift of myosin heavy chain. In the pCa-tension study using the 8 mM phosphate (Pi) solution, there was hardly any difference in Ca(2+) sensitivity (pCa50) and cooperativity (nH) between the mutant and WT samples. However, in the solutions without Pi, DAD showed increased nH and slightly decreased pCa50. We infer from these observations that the nonphosphorylatable residue 282 combined with phosphomimetic residues Asp(273) and/or Asp(302) (in DAD) is detrimental to cardiomyocytes by lowering isometric tension and altering cross-bridge kinetics with decreased 2πc and increased 2πb. In contrast, a single change of residue 282 to nonphosphorylatable Ala (SAS), or to phosphomimetic Asps together with the changes of residues 273 and 302 to nonphosphorylatable Ala (ADA) causes minute changes in fiber mechanics.
Copyright © 2014 Biophysical Society. Published by Elsevier Inc. All rights reserved.
Figures
Similar articles
-
Cardiac myosin binding protein C phosphorylation affects cross-bridge cycle's elementary steps in a site-specific manner.PLoS One. 2014 Nov 24;9(11):e113417. doi: 10.1371/journal.pone.0113417. eCollection 2014. PLoS One. 2014. PMID: 25420047 Free PMC article.
-
A critical function for Ser-282 in cardiac Myosin binding protein-C phosphorylation and cardiac function.Circ Res. 2011 Jul 8;109(2):141-50. doi: 10.1161/CIRCRESAHA.111.242560. Epub 2011 May 19. Circ Res. 2011. PMID: 21597010 Free PMC article.
-
Cardiac myosin binding protein-C phosphorylation accelerates β-cardiac myosin detachment rate in mouse myocardium.Am J Physiol Heart Circ Physiol. 2021 May 1;320(5):H1822-H1835. doi: 10.1152/ajpheart.00673.2020. Epub 2021 Mar 5. Am J Physiol Heart Circ Physiol. 2021. PMID: 33666504 Free PMC article.
-
Phosphorylation and function of cardiac myosin binding protein-C in health and disease.J Mol Cell Cardiol. 2010 May;48(5):866-75. doi: 10.1016/j.yjmcc.2009.11.014. Epub 2009 Dec 3. J Mol Cell Cardiol. 2010. PMID: 19962384 Free PMC article. Review.
-
Post-translational control of cardiac hemodynamics through myosin binding protein C.Pflugers Arch. 2014 Feb;466(2):231-6. doi: 10.1007/s00424-013-1377-y. Epub 2013 Oct 22. Pflugers Arch. 2014. PMID: 24145982 Free PMC article. Review.
Cited by
-
The genetic basis of hypertrophic cardiomyopathy in cats and humans.J Vet Cardiol. 2015 Dec;17 Suppl 1(Suppl 1):S53-73. doi: 10.1016/j.jvc.2015.03.001. J Vet Cardiol. 2015. PMID: 26776594 Free PMC article. Review.
-
High ionic strength depresses muscle contractility by decreasing both force per cross-bridge and the number of strongly attached cross-bridges.J Muscle Res Cell Motil. 2015 Jun;36(3):227-41. doi: 10.1007/s10974-015-9412-6. Epub 2015 Apr 3. J Muscle Res Cell Motil. 2015. PMID: 25836331 Free PMC article.
-
Peroxisome proliferator-activated receptor-α expression induces alterations in cardiac myofilaments in a pressure-overload model of hypertrophy.Am J Physiol Heart Circ Physiol. 2017 Apr 1;312(4):H681-H690. doi: 10.1152/ajpheart.00469.2016. Epub 2017 Jan 27. Am J Physiol Heart Circ Physiol. 2017. PMID: 28130336 Free PMC article.
-
Pathomechanisms in heart failure: the contractile connection.J Muscle Res Cell Motil. 2015 Feb;36(1):47-60. doi: 10.1007/s10974-014-9395-8. Epub 2014 Nov 7. J Muscle Res Cell Motil. 2015. PMID: 25376563 Review.
-
Cardiac myosin super relaxation (SRX): a perspective on fundamental biology, human disease and therapeutics.Biol Open. 2021 Feb 15;10(2):bio057646. doi: 10.1242/bio.057646. Biol Open. 2021. PMID: 33589442 Free PMC article. Review.
References
-
- Offer G., Moos C., Starr R. A new protein of the thick filaments of vertebrate skeletal myofibrils. Extractions, purification and characterization. J. Mol. Biol. 1973;74:653–676. - PubMed
-
- Winegrad S. Myosin-binding protein C (MyBP-C) in cardiac muscle and contractility. Adv. Exp. Med. Biol. 2003;538:31–40. discussion 40–41. - PubMed
-
- Bennett P.M., Fürst D.O., Gautel M. The C-protein (myosin binding protein C) family: regulators of contraction and sarcomere formation? Rev. Physiol. Biochem. Pharmacol. 1999;138:203–234. - PubMed
-
- Richard P., Charron P., Komajda M., EUROGENE Heart Failure Project Hypertrophic cardiomyopathy: distribution of disease genes, spectrum of mutations, and implications for a molecular diagnosis strategy. Circulation. 2003;107:2227–2232. - PubMed
-
- Mohamed A.S., Dignam J.D., Schlender K.K. Cardiac myosin-binding protein C (MyBP-C): identification of protein kinase A and protein kinase C phosphorylation sites. Arch. Biochem. Biophys. 1998;358:313–319. - PubMed
Publication types
MeSH terms
Substances
Grants and funding
LinkOut - more resources
Full Text Sources
Other Literature Sources
Research Materials
Miscellaneous
