. 2014 Mar 5;81(5):1024-1039.
doi: 10.1016/j.neuron.2014.01.037.

S-adenosylmethionine levels regulate the schwann cell DNA methylome

Affiliations

S-adenosylmethionine levels regulate the schwann cell DNA methylome

Marta Varela-Rey et al. Neuron. .

Abstract

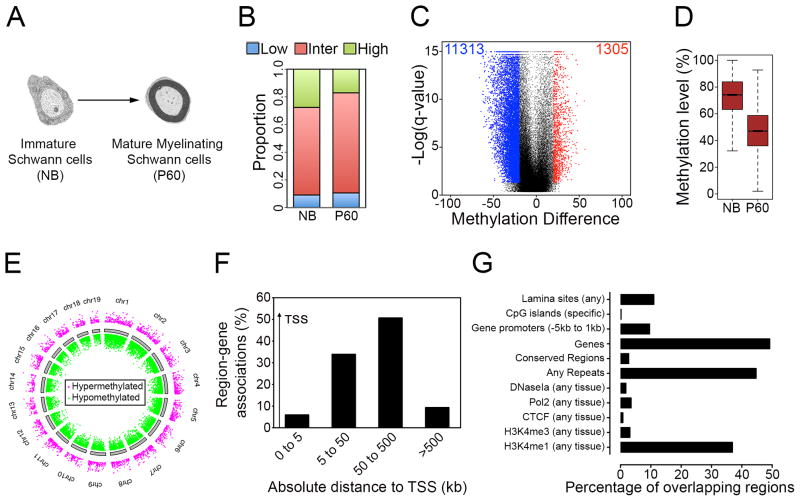
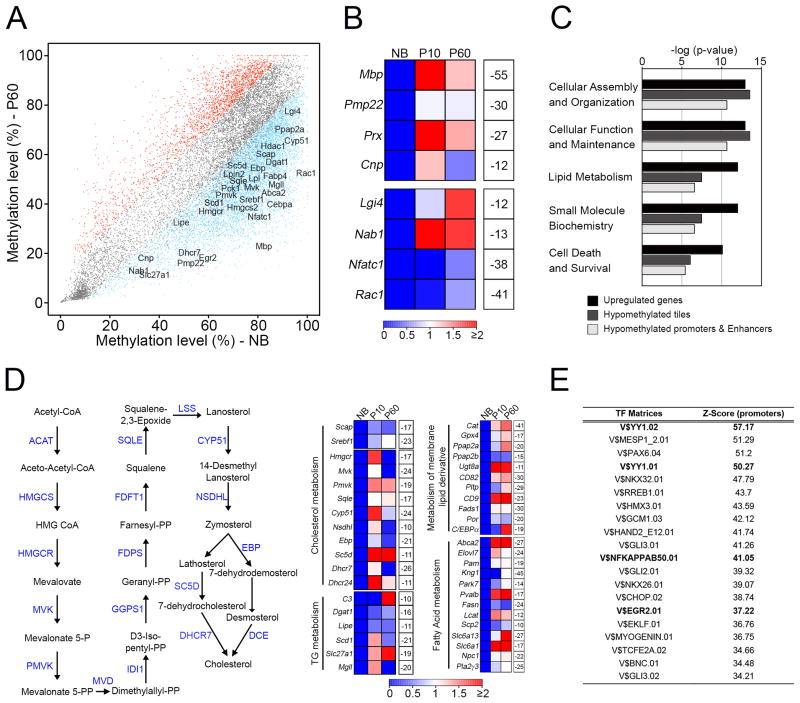
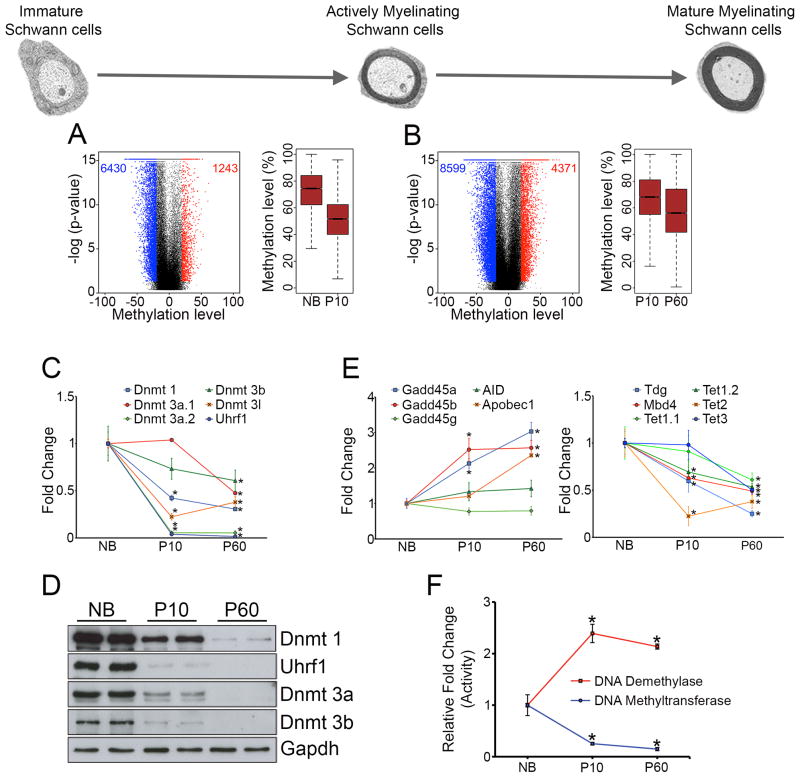
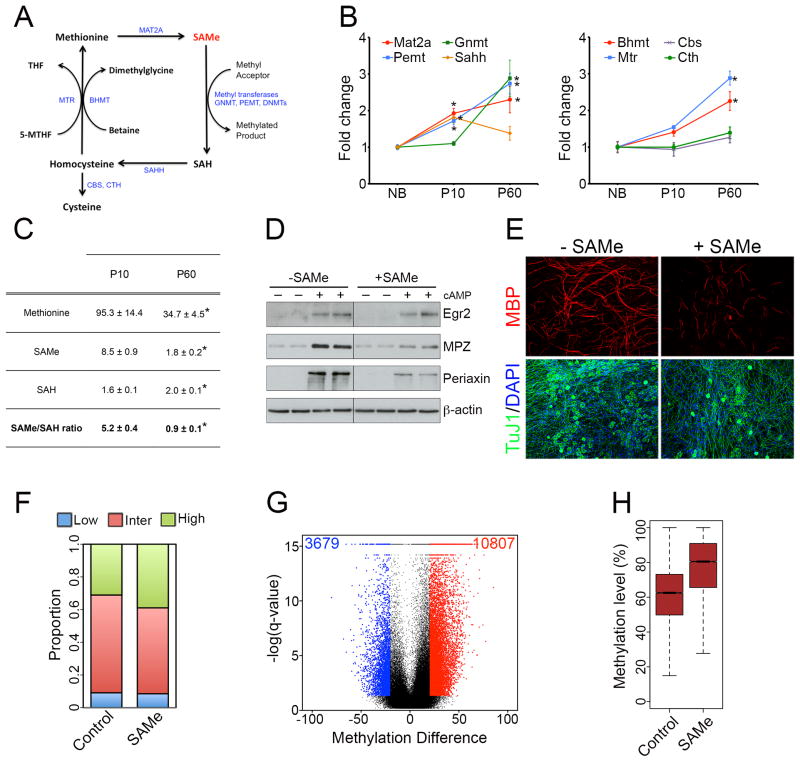
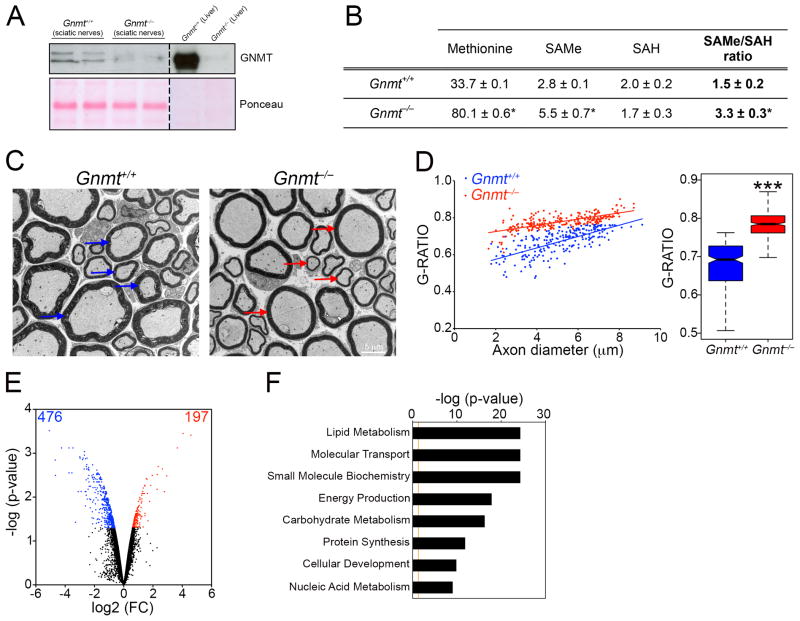
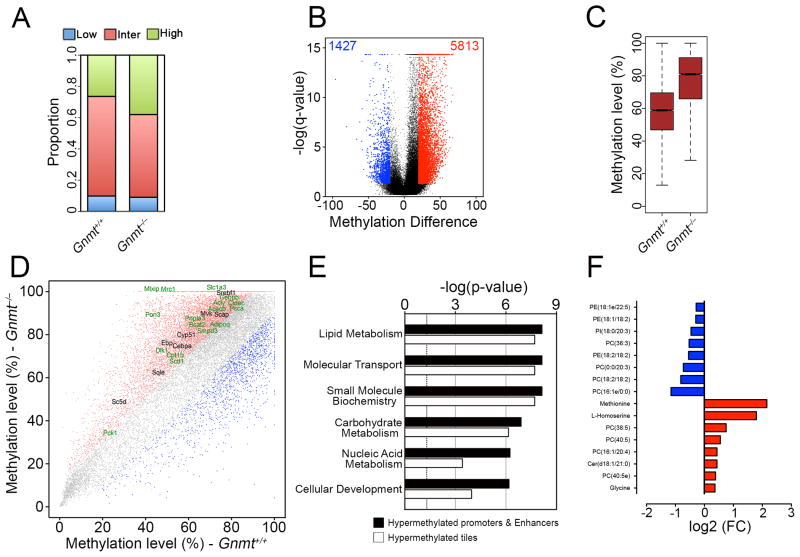
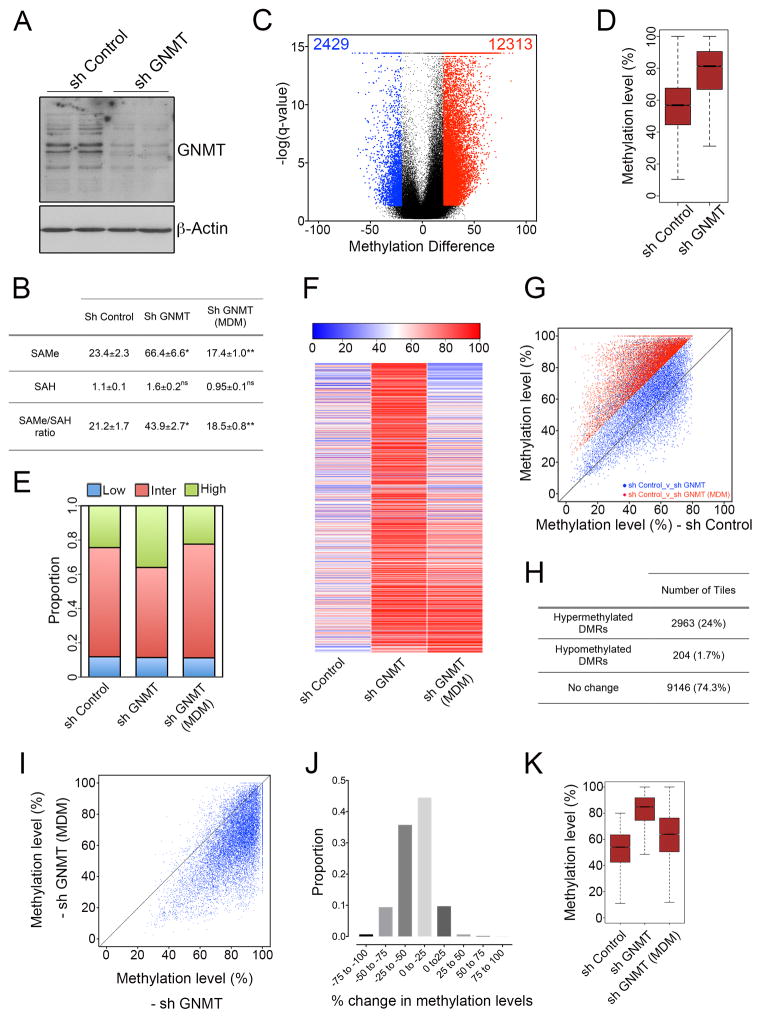
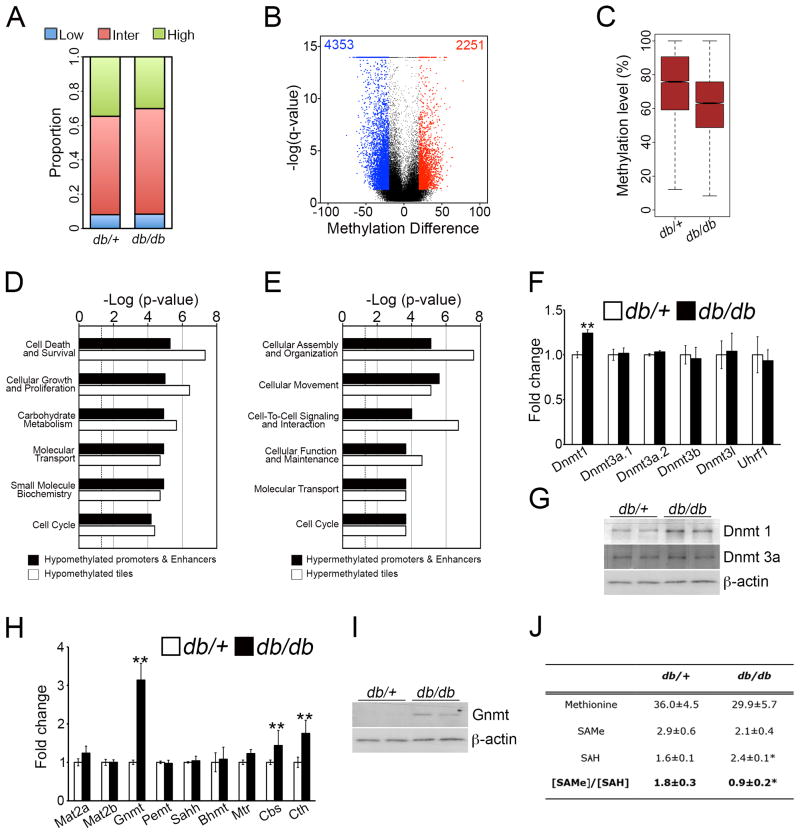
Axonal myelination is essential for rapid saltatory impulse conduction in the nervous system, and malformation or destruction of myelin sheaths leads to motor and sensory disabilities. DNA methylation is an essential epigenetic modification during mammalian development, yet its role in myelination remains obscure. Here, using high-resolution methylome maps, we show that DNA methylation could play a key gene regulatory role in peripheral nerve myelination and that S-adenosylmethionine (SAMe), the principal methyl donor in cytosine methylation, regulates the methylome dynamics during this process. Our studies also point to a possible role of SAMe in establishing the aberrant DNA methylation patterns in a mouse model of diabetic neuropathy, implicating SAMe in the pathogenesis of this disease. These critical observations establish a link between SAMe and DNA methylation status in a defined biological system, providing a mechanism that could direct methylation changes during cellular differentiation and in diverse pathological situations.


Figures

Figure 1
Figure 1. Methylation dynamics during Schwann cell myelination
(A) Stages of Schwann cell development used for RRBS analysis to show DNA methylation dynamics during Schwann cell myelination. Progenitor cells (immature Schwann cells) are enriched in NB peripheral nerves, and terminally differentiated cells (mature myelinating cells) are enriched in P60 peripheral nerves. (B) Proportion of 1-kb tiles with high (≥ 80%, green), intermediate (>20% and <80%, red) and low (≤20%, blue) percentage methylation levels. (C) Violin plot shows about a 9-fold greater number of hypomethylated DMRs (blue dots) than hypermethylated DMRs (red dots) in P60 nerves. Black dots represent regions with percentage methylation difference <20% and/or FDR>0.05. (D) Boxplot showing methylation levels of DMRs in 1-kb tiles. Boxplots correspond to center quartiles with black bar indicating median, and whiskers extend to the most extreme data point, which is no more than 1.5 times the interquartile range from the box. (E) Chromosome ideogram representing DMRs in P60 nerves compared to NB nerves (Magenta: hypermethylated DMRs; green: hypomethylated DMRs). (F) Histogram showing proportion of DMRs at relative distances from transcription start site (TSS), determined with GREAT software. (G) Histogram showing enrichment of DMRs in different genomic regions, determined with EpiExplorer software. See also Figure S1 and Table S1.
Figure 2
Figure 2. Global demethylation during Schwann cell myelination
(A) Scatterplot of percentage DNA methylation levels of 1-kb tiles, showing hypomethylated regions (blue) and hypermethylated regions (red) in P60 nerves, relative to NB nerves. Selected genes with important functions in Schwann cell myelination are highlighted. (B) Heatmap showing changes in expression of myelination-related genes from microarray data (Table S2) in P10 and P60 nerves, compared to NB nerves (red-blue color scale), and methylation difference in P60 nerves relative to NB nerves (white boxes). (C) GO analysis showing top Molecular and Cellular Function categories enriched in all up-regulated genes, up-regulated genes that become hypomethylated in tiling regions and up-regulated genes that become hypomethylated at promoter and putative enhancer regions. (D) Scheme of the cholesterol biosynthesis pathway in which the site of action of enzymes (blue) is shown (left). Heatmaps (right) showing changes in expression of genes from microarray experiments associated with cholesterol biosynthesis and distinct aspects of lipid metabolism in P10 and P60 nerves compared to NB nerves (red-blue color scale). Percentage methylation difference in P60 nerves relative to NB nerves is shown in white boxes. (E) Table showing enrichment of transcription factor recognition motifs in hypomethylated 1-kb tiling regions using Genomatix RegionMiner. Each row represents a cis-regulatory module with significant over-representation relative to a random set of mammalian promoters (Z-score). See also Figure S2 and Table S2.
Figure 3
Figure 3. Methylation dynamics and methyltransferase expression during different stages of Schwann cell myelination
(A, B) DNA methylation changes (refer to Figure 1C, D) between (A) actively myelinating Schwann cells (P10) relative to immature Schwann cells (NB) and, (B) mature myelinating Schwann cells (P60) relative to actively myelinating Schwann cells (P10). (C, D) DNA methyltransferases are downregulated during Schwann cell myelination, as shown by (C) qPCR analysis and (D) Western blotting (WB). (E) qPCR analysis of regulators associated with active DNA demethylation. (F) Assay of total DNA methyltransferase and demethylase activity during Schwann cell myelination. Data is mean ± sem, *p < 0.01, n=3, Student’s t-test. See also Figure S3 and Table S3.
Figure 4
Figure 4. SAMe levels are reduced during Schwann cell myelination, and SAMe supplementation blocks Schwann cell myelination in vitro
(A) Schematic representation of the methionine cycle, in which the site of action of different enzymes involved (blue) is shown. (B) qPCR analysis showing differential expression of the main genes involved in the methionine cycle during Schwann cell myelination. Data is mean ± sem, *p < 0.01, n=3, Student’s t-test. (C) Table showing levels of the metabolites methionine, SAMe and SAH (pmol mg−1 of tissue), and the SAMe/SAH ratio in P10 and P60 nerves. Data is mean ± sem, *p < 0.05, n=5, Student’s t-test. (D) WB showing that exogenous SAMe supplementation prevents up-regulation of the myelin proteins Mpz and Periaxin under myelinogenic conditions (cAMP treatment). β-actin is shown as a loading control. (E) Immunocytochemistry showing fewer MBP+ myelinated segments (red) in SAMe-treated DRG-Schwann cell co-cultures. Note that axonal network (Tuj1+ cells, green) appear normal in both control and SAMe-treated cultures. (F) Proportion of 1-kb tiles with high (≥80%, green), intermediate (>20% and <80%, red) and low (≤20%, blue) percentage methylation levels in control and SAMe-treated cultures. (G) Violin plot showing about a 3-fold greater number of hypermethylated tiling regions (red) in SAMe-treated cultures than hypomethylated tiling regions. Black dots represent regions with percentage methylation difference <20% and/or FDR>0.05. (H) Boxplot showing an increased median methylation level in differentially-methylated tiling regions. See also Figure S4 and Table S4.
Figure 5
Figure 5. Elevated SAMe levels in Gnmt−/− mice lead to hypomyelination and gene expression changes
(A) WB showing that GNMT is absent in sciatic nerves from Gnmt−/− mice. Liver, where GNMT is highly expressed (representing 1% of total protein)(Lu and Mato, 2012), is shown as a control. Ponceau is used as a loading control, since we found that GAPDH and β-actin were respectively downregulated and upregulated in Gnmt−/− nerves. (B) Table showing levels of the metabolites methionine, SAMe and SAH (pmol mg−1 of tissue), and the SAMe/SAH ratio in Gnmt+/+ and Gnmt−/− mice. Data is mean ± sem, *p < 0.01, n=5, Student’s t-test. (C) Electron micrographs showing thinner myelin sheaths (red arrows) in nerves from Gnmt−/− mice, compared to normal-sized myelin sheaths in Gnmt+/+ mice (blue arrows). (D) Morphometric analysis of myelinated axons in nerves from Gnmt+/+ and Gnmt−/− mice, showing G-ratio measurements, expressed as individual measurements in scatterplot (left), or boxplot (right)(***p<0.01, n=5, Student’s t-test). (E) Violin plot showing gene expression changes in Gnmt−/− mice compared to Gnmt+/+ mice, with a higher proportion of downregulated (blue) than upregulated genes (red). (F) GO analysis showing top Molecular and Cellular Function categories enriched in downregulated genes in Gnmt−/− mice. See also Table S5.
Figure 6
Figure 6. Elevated SAMe levels in Gnmt−/− mice lead to global and locus-specific DNA hypermethylation
(A) Proportion of 1-kb tiles with high (≥80%, green), intermediate (>20% and <80%, red) and low (≤20%, blue) percentage methylation levels. (B) Violin plot showing about a 3-fold greater number of hypermethylated tiling regions (red) in Gnmt−/− mice than hypomethylated tiling regions. Black dots represent regions with percentage methylation difference <20% and/or FDR>0.05. (C) Boxplot showing an increased median methylation level in differentially-methylated tiling regions in Gnmt−/− mice. (D) Scatterplot of DNA methylation of 1-kb tiles showing hypomethylated regions (blue) and hypermethylated regions (red) in Gnmt−/− mice. Selected hypermethylated genes are highlighted (genes which are downregulated are shown in green). (E) GO analysis showing top Molecular and Cellular Function categories enriched in all downregulated genes hypermethylated at tiling regions or gene-regulatory regions. (F) Histogram showing most-significantly changed lipid species and amino acids in Gnmt−/− mice compared to Gnmt+/+ mice. See also Figure S5 and Table S6.
Figure 7
Figure 7. DNA hypermethylation induced by GNMT silencing in vitro is reverted by culture in low methionine medium
(A) Western blot showing reduced GNMT levels in sh GNMT-infected Schwann cells compared to sh Control-infected cells. β-Actin is used as a loading control. (B) Table showing the levels of the metabolites SAMe and SAH (pmol per 2×10⁶ cells), and the SAMe/SAH ratio in sh Control, sh GNMT and sh GNMT (MDM) cells. Data is mean ± sem, *p<0.05, n=5, Student’s t-test. Increase in SAMe levels, and the SAMe/SAH ratio induced by GNMT silencing is prevented by culture in low methionine medium. (C) Violin plot showing about a 5-fold greater number of hypermethylated tiling regions (red) than hypomethylated tiling regions (blue) in GNMT-silenced cells compared to control cells. Black dots represent regions with percentage methylation difference <20% and/or FDR>0.05. (D) Boxplot showing an increased median methylation level in differentially-methylated tiling regions. (E–K) Increased methylation induced in GNMT-silenced cells is prevented by culture in low methionine medium. (E) Proportion of 1-kb tiles with high (≥80%, green), intermediate (>20% and <80%, red) and low (≤20%, blue) percentage methylation levels. (F) Heatmap showing the absolute methylation levels of all hypermethylated 1kb tiles in the comparison sh GNMT_v_sh Control. When the GNMT-silenced cells were cultured in low methionine medium, there was a significant decrease in the methylation levels of many of the tiles. (G) Scatterplot showing that the large majority of tiles classified as hypermethylated DMRs (q<0.05, methylation increase of 20%) in the comparison sh GNMT_v_sh Control (red) did not show significant differences in methylation levels (methylation difference of 20%) in the comparison sh GNMT (MDM)_v_sh Control (blue). (H) Counts of the tiles (hypermethylated DMRs in the comparison sh GNMT_v_sh Control) classified as hypermethylated DMRs, hypomethylated DMRs, or with no change (methylation difference < 20%) in the comparison sh GNMT (MDM)_v_sh Control. Out of the 12,313 tiles hypermethylated in the comparison sh GNMT_v_sh Control, about 75% of them (9146) did not show significant methylation differences (methylation difference of 20% or q-value > 0.05) in the comparison sh GNMT (MDM)_v_sh Control. (I) Scatterplot of percentage DNA methylation levels of 1-kb tiles (12,313 tiles hypermethylated in the comparison sh GNMT_v_sh Control) in sh GNMT and sh GNMT (MDM) cultures. sh GNMT (MDM) cultures have an overall lower methylation level than sh GNMT cultures. (J) Graph showing the proportion of tiles with different changes in methylation levels in the comparison sh GNMT (MDM)_v_sh GNMT. A large number of tiles have a decreased methylation level of at least 25%, with a minimum number of tiles showing increased methylation. (K) Boxplot showing increased methylation levels of all differentially-methylated 1-kb tiling regions (q<0.05, methylation difference of 20%) in GNMT-silenced cells cultures (sh GNMT) compared to control cultures (sh Control). This effect is abolished when sh GNMT cells were cultured in low methionine medium (sh GNMT_MDM). See also Figure S6 and Table S7.
Figure 8
Figure 8. DNA is globally hypomethylated in db/db mice at P180, correlating with reduced SAMe levels
(A) Proportion of 1-kb tiles with high (≥80%, green), intermediate (>20% and <80%, red) and low (≤20%, blue) percentage methylation levels. (B) Violin plot showing about a 2-fold greater number of hypomethylated tiling regions (blue) in db/db mice compared to db/+ mice. (C) Boxplot showing a decreased methylation level in differentially-methylated tiling regions in db/db mice. (D) GO analysis showing top Molecular and Cellular Function categories enriched in upregulated genes that are hypomethylated at tiling regions or gene-regulatory regions. (E) GO analysis showing top Molecular and Cellular Function categories enriched in all downregulated genes that are hypermethylated at tiling regions or gene-regulatory regions. (F, G) Dnmt1 is upregulated in nerves from db/db mice, as shown by (F) qPCR analysis and (G) Western blotting. (H) qPCR analysis showing relative transcript levels of enzymes involved in methionine cycle. Data is mean ± sem, *p < 0.01, n=3, Student’s t-test. (I) Western blot analysis confirming higher GNMT expression in db/db mice. (J) Table showing levels of the metabolites methionine, SAMe and SAH (pmol mg−1 of tissue), and the SAMe/SAH ratio in db/+ and db/db mice. Data is mean ± sem, *p<0.01, n=5, Student’s t-test. See also Figure S7 and Table S8.

References

    1. Barr J, Caballeria J, Martinez-Arranz I, Dominguez-Diez A, Alonso C, Muntane J, Perez-Cormenzana M, Garcia-Monzon C, Mayo R, Martin-Duce A, et al. Obesity-dependent metabolic signatures associated with nonalcoholic fatty liver disease progression. J Proteome Res. 2012;11:2521–2532. - PMC - PubMed
    1. Beck CR, Garcia-Perez JL, Badge RM, Moran JV. LINE-1 elements in structural variation and disease. Annu Rev Genomics Hum Genet. 2011;12:187–215. - PMC - PubMed
    1. Bhutani N, Burns DM, Blau HM. DNA demethylation dynamics. Cell. 2011;146:866–872. - PMC - PubMed
    1. Bock C. Analysing and interpreting DNA methylation data. Nat Rev Genet. 2012;13:705–719. - PubMed
    1. Bock C, Beerman I, Lien WH, Smith ZD, Gu H, Boyle P, Gnirke A, Fuchs E, Rossi DJ, Meissner A. DNA methylation dynamics during in vivo differentiation of blood and skin stem cells. Mol Cell. 2012;47:633–647. - PMC - PubMed

Publication types

Substances