. 2014 Mar 5;81(5):1152-1164.
doi: 10.1016/j.neuron.2014.01.025.

The adaptive trade-off between detection and discrimination in cortical representations and behavior

Affiliations

The adaptive trade-off between detection and discrimination in cortical representations and behavior

Douglas R Ollerenshaw et al. Neuron. .

Abstract

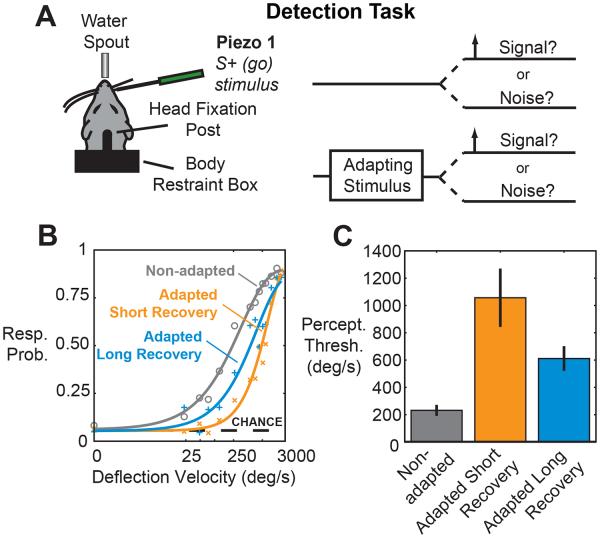
It has long been posited that detectability of sensory inputs can be sacrificed in favor of improved discriminability and that sensory adaptation may mediate this trade-off. The extent to which this trade-off exists behaviorally and the complete picture of the underlying neural representations that likely subserve the phenomenon remain unclear. In the rodent vibrissa system, an ideal observer analysis of cortical activity measured using voltage-sensitive dye imaging in anesthetized animals was combined with behavioral detection and discrimination tasks, thalamic recordings from awake animals, and computational modeling to show that spatial discrimination performance was improved following adaptation, but at the expense of the ability to detect weak stimuli. Together, these results provide direct behavioral evidence for the trade-off between detectability and discriminability, that this trade-off can be modulated through bottom-up sensory adaptation, and that these effects correspond to important changes in thalamocortical coding properties.


Figures

Figure 1
Figure 1. In-vivo VSD imaging of the rat barrel cortex.
A. A piezoelectric actuator delivered a probe deflection to either of two adjacent whiskers while a camera system simultaneously collected fluorescence signal from layer 2/3 of an anesthetized rat. The top panel shows an example response to a single whisker deflection (850 °/s, rostral-caudal) averaged over 50 trials. Overlaid on the VSD images is an outline of barrels functionally registered using the responses to different whisker deflections. B. The cortical responses to a single-whisker stimulation in the absence of a preceding 10 Hz adapting stimulus. Whisker 1 (W1) and whisker 2 (W2) were adjacent to each other on the snout and stimulated separately. Images were averaged over 50 trials. The black ellipses on the images were half-height contours of the two-dimensional Gaussian fits to the images. On the right is the superposition of the Gaussian contours. C. In contrast, the same stimulus following a 10 Hz adapting stimulus evoked a cortical response that was significantly reduced in magnitude and in area. See also Figure S1.
Figure 2
Figure 2. Ideal observer analysis - Adaptation enhances discrimination at the expense of detection.
A. A region of interest (ROI) approximately the size of a cortical column (300-500 μm in diameter) was defined as the 98% height contour of the 2D Gaussian fit to the trial-averaged non-adapted response. The insets show the corresponding trial-averaged images for each case (noise, non-adapted, and adapted), with the ROI outlined in black (same in all cases). The average fluorescence within the ROI was extracted from each single trial as a decision variable (DV). B. The d’ value, a measure of the separation of the signal and noise distributions, decreased following adaptation (p < 0.005, n = 18, paired t-test). C. The same method described in the detection analysis was used to derive the ROI for each of the two whisker stimulations (shown in bold ellipse). Both ROIs were applied to all single trials. Two responses were calculated for each single trial: the average fluorescence within the principal barrel area (bold ellipse), and that within the adjacent barrel area (thin ellipse). D. Responses above the detection threshold in the non-adapted case were grouped by whisker stimulation and separated using Linear Discriminant Analysis (LDA). The decision variable was defined as the projection of the response onto the axis orthogonal to the LDA line. The d’ separation measure was then calculated for the two probability distributions of the decision variables. The d’ in this example was 1.7. E. Same analysis as in D for the adapted case. The d’ in this example was 3.2. F. Discrimination performance (d’ of DV probability distributions) of the ideal observer significantly improved following adaptation (p < 0.05, n = 9, paired t-test). All error bars represent +/− 1 standard error of the mean. See also Figure S2.
Figure 3
Figure 3. Behavioral detection thresholds are increased with adaptation.
A. Detection task. A piezoelectric actuator was placed on a single whisker, and a variable velocity probe stimulus was presented at a randomized time. The probe was preceded by an adapting stimulus on 50% of trials. B. Combined psychometric curve for all animals, for the non-adapted (grey), adapted short recovery (orange) and long recovery (blue) cases. Error bars are omitted for clarity. The black dashed line indicates the chance performance level. C. Quantification of perceptual thresholds. Each bar represents the perceptual threshold, measured as the 50% point of the sigmoidal fit (non-adapted to adapted short recovery: p < 0.05; non-adapted to adapted long recovery: p < 0.05; paired t-test, n = 4). Error bars represent +/− 1 standard error of the mean. See also Figure S3.
Figure 4
Figure 4. The spatial discrimination performance of the animals is improved with adaptation.
A. Discrimination task. A second piezoelectric actuator was introduced on a nearby whisker. The task proceeded as in the detection task, with the exception that on a given trial either the S+ (go whisker) or the S- (no-go) whisker was deflected with equal probability using a fixed supra-threshold velocity. Animals were rewarded as before for responses to the S+ stimulus, but were penalized with a timeout for responses to deflections of the S- whisker. B. Raw response probabilities. Response probabilities to S+ and S- stimuli are shown in green and red. From top to bottom, each pair of bars represents the non-adapted state, the adapted short recovery state and the adapted long recovery state. C. Discriminability quantified as the ratio of the hit rate to the false alarm rate. Discriminability is measured using the data in B for the non-adapted (grey), adapted short recovery (orange) and adapted long recovery (blue) states. (non-adapted to adapted short recovery: p < 0.005; non-adapted to adapted long recovery: p < 0.05; paired t-test, n = 5). All error bars represent +/− 1 standard error of the mean. See also Figure S4.
Figure 5
Figure 5. Adaptation of thalamic VPm cells in the awake animal.
A. The combined PSTH for all animals and recording sessions. B. The number of spikes per stimulus for each pulse in the 3 s, 10 Hz train of adapting stimuli, normalized to the spike count in response to the first pulse. After adaptation, the firing rate was 79.2% of its non-adapted value. C. Timing precision, as measured using TC40, decreased from 0.217 +/− 0.008 spikes/ms in the non-adapted state to 0.145 +/− 0.008 spikes/ms after adaptation. The inset shows the first and last PSTH combined across all animals and recording sessions. All error bars represent +/− 1 standard error of the mean (all values p < 0.005, n = 56, two sided t-test comparing response to first pulse with response to final 3 pulses combined). See also Figure S5.
Figure 6
Figure 6. Firing rate and timing precision in response to the probe stimulus.
A. Scatter plot of spikes in a 30 ms window following the probe stimulus. On a given session, both the mean spike count in response to short recovery stimuli (those falling in the 0.5-1.5 s post-adaptation window, shown as orange Xs) and long recovery stimuli (those falling in the 1.5-2.5 s post adaptation window, shown as blue Os) are plotted against the mean number of spikes elicited by non-adapted probe stimuli. Gray lines connect data points from a given session. B. Same data as A, but each data point is normalized against the non-adapted value. C. Scatter plot of firing precision measured as TC40. Same conventions as A. D. Same data as C, but each data point is normalized against the non-adapted value. All error bars represent +/− 1 standard error of the mean.
Figure 7
Figure 7. Simulated cortical response from experimentally measured changes in thalamic firing in the awake animal
A. A schematic of the model configuration. Each barreloid-to-barrel connection is treated as an isolated circuit. Each thalamic barreloid in VPm nucleus of the thalamus contains only excitatory relay cells. The input neurons in layer 4 of the cortex consist of both excitatory regular spiking units (RSUs) and inhibitory fast spiking units (FSUs). These cells receive both thalamocortical and intracortical inputs. Sample thalamic input spike trains are shown below each column, demonstrating the reduction in precision and spike count with distance from the principal whisker (PW) that is built into the model. B. The output of the model, which is the number of spikes generated by the regular spiking units in each barrel, in response to a deflection of the PW. The black line represents trials in which only the spike count was allowed to adapt but the timing precision was held constant. C. The sharpness of the cortical response, here measured as the difference in normalized activity in the principal and adjacent whiskers. The response was strongly sharpened with adaptation. However, when allowing only the firing rate to change with adaptation, but holding timing synchrony constant before and after adaptation (labeled as synchrony controlled), the sharpening effect is less pronounced. The increased cortical sharpness with adaptation predicts improved discriminability. All error bars represent +/− 1 standard deviation.

References

    1. Ahissar E, Sosnik R, Haidarliu S. Transformation from temporal to rate coding in a somatosensory thalamocortical pathway. Nature. 2000;406:302–306. - PubMed
    1. Alonso JM, Usrey WM, Reid RC. Precisely correlated firing in cells of the lateral geniculate nucleus. Nature. 1996;383:815–819. - PubMed
    1. Barlow H. Possible principles underlying the transformation of sensory messages. In Sensory Communication. 1961:271–274.
    1. von Békésy G. Neural volleys and the similarity between some sensations produced by tones and by skin vibrations. The Journal of the Acoustical Society of America. 1957;29:1059–1069.
    1. Brecht M, Preilowski B, Merzenich MM. Functional architecture of the mystacial vibrissae. Behavioural Brain Research. 1997;84:81–97. - PubMed

Publication types

LinkOut - more resources