

Reconstruction of dual-frequency conductivity by optimization of phase map in MREIT and MREPT
- PMID: 24607262
- PMCID: PMC3995946
- DOI: 10.1186/1475-925X-13-24
Reconstruction of dual-frequency conductivity by optimization of phase map in MREIT and MREPT
Abstract
Background: The spectroscopic conductivity distribution of tissue can help to explain physiological and pathological status. Dual frequency conductivity imaging by combining Magnetic Resonance Electrical Property Tomography (MREPT) and Magnetic Resonance Electrical Impedance Tomography (MREIT) has been recently proposed. MREIT can provide internal conductivity distributions at low frequency (below 1 kHz) induced by an external injecting current. While MREPT can provide conductivity at the Larmor frequency related to the strength of the magnetic field. Despite this potential to describe the membrane properties using spectral information, MREPT and MREIT techniques currently suffer from weak signals and noise amplification as they both reply on differentiation of measured phase data.
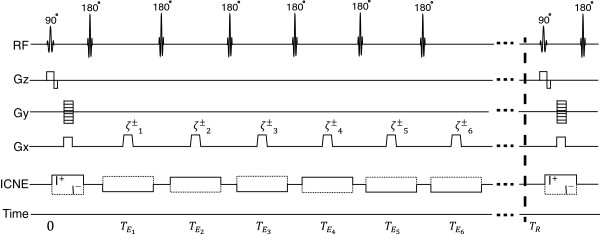
Methods: We proposed a method to optimize the measured phase signal by finding weighting factors according to the echo signal for MREPT and MREIT using the ICNE (Injected current nonlinear encoding) multi-echo pulse sequence. Our target weights are chosen to minimize the measured noise. The noise standard deviations were precisely analyzed for the optimally weighted magnetic flux density and the phase term of the positive-rotating magnetic field. To enhance the quality of dual-frequency conductivity images, we applied the denoising method based on the reaction-diffusion equation with the estimated noise standard deviations. A real experiment was performed with a hollow cylindrical object made of thin insulating film with holes to control the apparent conductivity using ion mobility and an agarose gel cylinder wrapped in an insulating film without holes to show different spectroscopic conductivities.
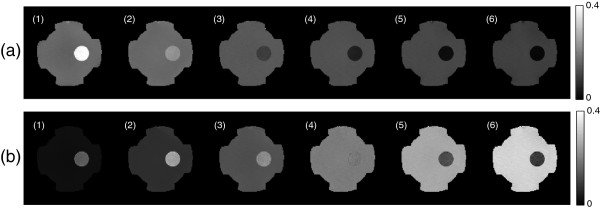
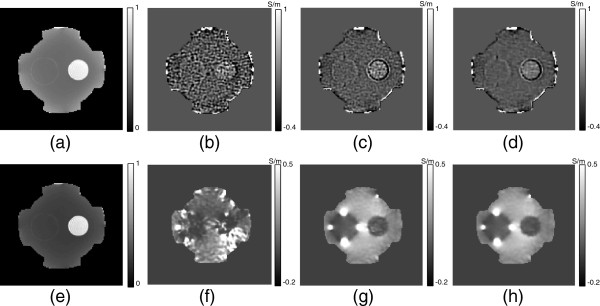
Results: The ability to image different conductivity characteristics in MREPT and MREIT from a single MR scan was shown by including the two objects with different spectroscopic conductivities. Using the six echo signals, we computed the optimized weighting factors for each echo. The qualities of conductivity images for MREPT and MREIT were improved by optimization of the phase map. The proposed method effectively reduced the random noise artifacts for both MREIT and MREPT.
Conclusion: We enhanced the dual conductivity images using the optimally weighted magnetic flux density and the phase term of positive-rotating magnetic field based on the analysis of the noise standard deviations and applying the optimization and denoising methods.
Figures


References
-
- Holder DS. Electrical Impedance Tomography: Methods, History and Applications. Bristol, UK: IOP Publishing; 2005.
-
- Ider YZ, Birgul O. Use of the magnetic field generated by the internal distribution of injected currents for electrical impedance tomography (mr-eit) Elektrik. 1998;6(3):215–225.
Publication types
MeSH terms
Substances
LinkOut - more resources
Full Text Sources
Other Literature Sources
Medical
