

Effects of buffer size and shape on associations between the built environment and energy balance
- PMID: 24607875
- PMCID: PMC4028172
- DOI: 10.1016/j.healthplace.2014.02.003
Effects of buffer size and shape on associations between the built environment and energy balance
Abstract
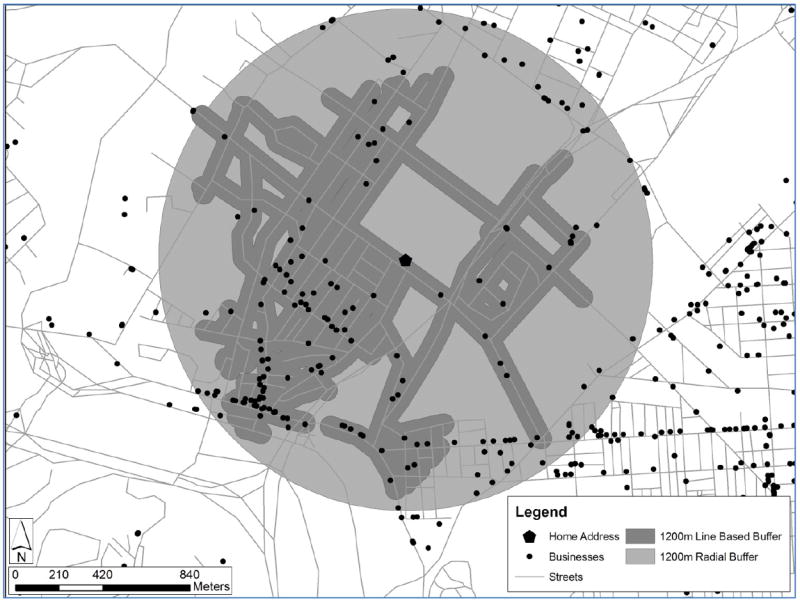
Uncertainty in the relevant spatial context may drive heterogeneity in findings on the built environment and energy balance. To estimate the effect of this uncertainty, we conducted a sensitivity analysis defining intersection and business densities and counts within different buffer sizes and shapes on associations with self-reported walking and body mass index. Linear regression results indicated that the scale and shape of buffers influenced study results and may partly explain the inconsistent findings in the built environment and energy balance literature.
Keywords: Body mass index; Built environment; Geographic information systems; Spatial uncertainty; Walking.
Copyright © 2014 Elsevier Ltd. All rights reserved.
Figures


References
-
- Ainsworth BE, Haskell WL, Leon AS, Jacobs DR, Jr, Montoye HJ, Sallis JF, Paffenbarger RS., Jr Compendium of physical activities: classification of energy costs of human physical activities. Medicine and Science in Sports and Exercise. 1993;25:71–80. - PubMed
Publication types
MeSH terms
Grants and funding
LinkOut - more resources
Full Text Sources
Other Literature Sources
