. 2014 Apr;73(4):362-74.
doi: 10.1097/NEN.0000000000000060.

Age-related brain expression and regulation of the chemokine CCL4/MIP-1β in APP/PS1 double-transgenic mice

Affiliations

Age-related brain expression and regulation of the chemokine CCL4/MIP-1β in APP/PS1 double-transgenic mice

Min Zhu et al. J Neuropathol Exp Neurol. 2014 Apr.

Abstract

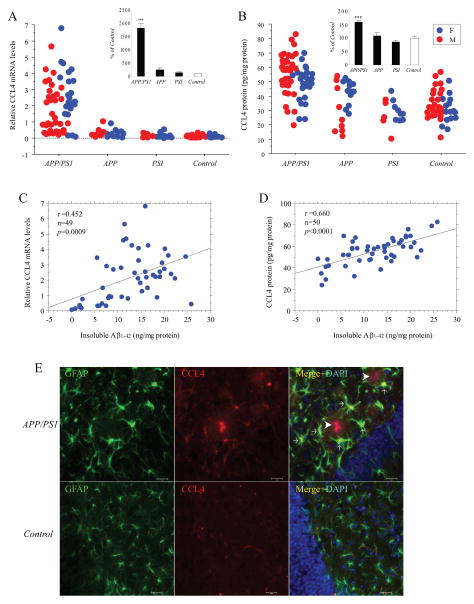
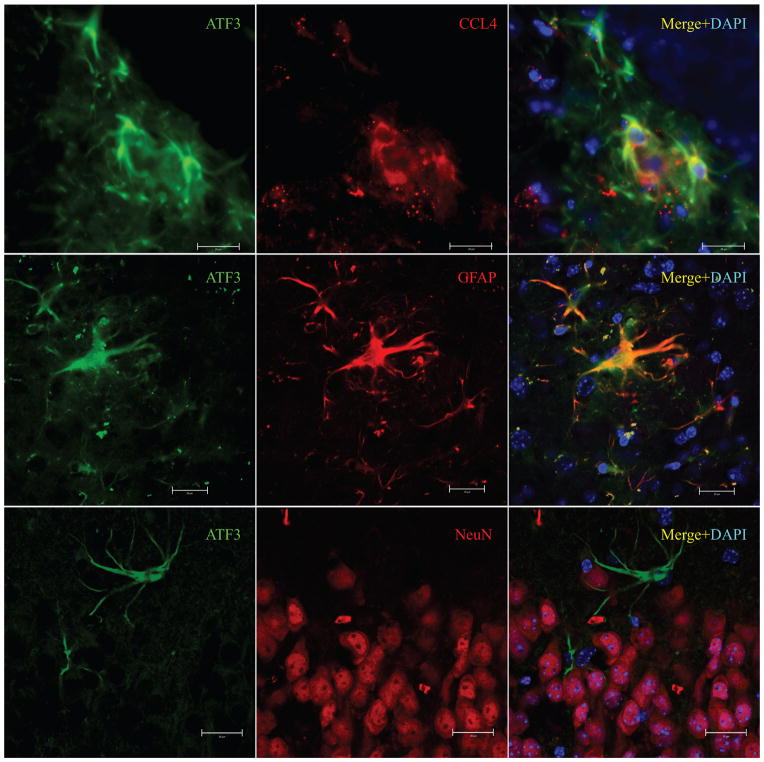
The detrimental effect of activation of the chemokine CCL4/MIP-1β on neuronal integrity in patients with HIV-associated dementia has directed attention to the potential role of CCL4 expression and regulation in Alzheimer disease. Here, we show that CCL4 mRNA and protein are overexpressed in the brains of APPswe/PS1ΔE9 (APP/PS1) double-transgenic mice, a model of cerebral amyloid deposition; expression was minimal in brains from nontransgenic littermates or single-mutant controls. Increased levels of CCL4 mRNA and protein directly correlated with the age-related progression of cerebral amyloid-β (Aβ) levels in APP/PS1 mice. We also found significantly increased expression of activating transcription factor 3 (ATF3), which was positively correlated with age-related Aβ deposition and CCL4 in the brains of APP/PS1 mice. Results from chromatin immunoprecipitation-quantitative polymerase chain reaction confirmed that ATF3 binds to the promoter region of the CCL4 gene, consistent with a potential role in regulating CCL4 transcription. Finally, elevated ATF3 mRNA expression in APP/PS1 brains was associated with hypomethylation of the ATF3 gene promoter region. These observations prompt the testable hypothesis for future study that CCL4 overexpression, regulated in part by hypomethylation of the ATF3 gene, may contribute to neuropathologic progression associated with amyloid deposition in Alzheimer disease.


Conflict of interest statement

The authors declare no conflicting financial interests with regard to the current study.

Figures

Figure 1
Figure 1
Amyloidosis and amyloid-β (Aβ)-mediated inflammation in APP/PS1 mouse brains. (A) Insoluble Aβ1–42 in the brains of mutant and control animals at various ages (APPswe/PS1ΔE9 double mutants, APP/PS1, n = 50, median age = 10.7 months; APPswe single mutant, APP, n = 15, median age = 15.0 months; PS1ΔE9 single mutant, PS1, n = 11, median age = 8.1 months and non-transgenic littermates, control, n = 32, median age = 11.4 months). Amount of Aβ1–42 was determined by ELISA and normalized to total protein content in the same sample. Insert represents mean ± SE, expressed as percent of control. ***p < 0.0001 vs. all other groups determined by 2-way ANOVA (genotype by sex) and post hoc Fisher tests. (B) Insoluble Aβ1–42 levels in the brains of APP/PS1 mice as a function of age. The p value was determined by correlation z-test. (C) Soluble Aβ1–42 in the brains (left panel) and plasma (right panel) from 10 to 11-mo old APP/PS1 and Control mice. Data are mean ± SE, n = 8–12/group, expressed as percent of control. *p < 0.05, ***p < 0.0001 vs. control determined by unpaired Student t test. (D) Representative photomicrographs of an 11-month-old APP/PS1 and an age-matched control brain stained with anti-Aβ17–24 antibody. (E) Representative photomicrographs of an 11-mo old APP/PS1 and age-matched control brain stained with anti-glial fibrillary acidic protein antibody and Congo red.
Figure 2
Figure 2
CCL4 expression and correlation with amyloid-β (Aβ) levels in mouse brains. (A, B) Levels of CCL4 mRNA and protein in the brains of mutant and control animals at various ages in 4 different genotypes (APP/PS1, n = 61, median age = 10.9 months; APP, n = 21, median age = 13.0 months; PS1, n = 16, median age = 9.6 months and control, n = 36, median age = 11.0 months) were determined by real-time qRT-PCR and ELISA, respectively, and normalized to either mouse tubulin gene (A) or the total protein content (B) in the same sample. Inserts represent mean ± SE, expressed as percent of control. ***p < 0.0001 vs. all other groups determined by 2-way ANOVA (genotype by sex) and post hoc Fisher tests. (C, D) CCL4 mRNA (C) and protein (D) in the brains of APP/PS1 mice as a function of cerebral insoluble Aβ1–42 levels. The p values were determined by correlation z-test. (E) Confocal double stained immunofluorescence images showing glial fibrillary acidic protein (GFAP) (green), CCL4 (red), and colocalization (yellow) identified by arrows in the brains of APP/PS1 and control mice. DAPI, shown as blue; arrowheads point to Aβ plaques associated with CCL4 staining; scales bar = 20 μm.
Figure 3
Figure 3
Binding of activating transcription factor 3 (ATF3) to the promoter of the CCL4 gene in mouse brain. (A) Sequence of the muCCL4 gene promoter. Underlined are the ATF3-binding motif and the putative TATA box. The start site of transcription is indicated with +1. The 5′ boundary of the primer (pM140) is marked by bent arrows. (B) Chromatin immunoprecipitation (ChIP) sheared, cross-linked genomic DNA from APP/PS1 and control brains was immunoprecipitated (IP) with antibody specific to ATF3 or normal rabbit IgG. The presence of the CCL4 promoter in IP materials was quantified by real-time qPCR with primers specific to the promoter region of the CCL4 gene and expressed as percent of input DNA fraction (mean ± SE, n = 3/group) in the lower panel. Representative PCR products stained by SYBR are shown in the upper panel.
Figure 4
Figure 4
Activating transcription factor 3 (ATF3) expression and correlation with CCL4 mRNA and amyloid β (Aβ) in mouse brains. (A) Levels of ATF3 mRNA in the brains of the same animals of various aged used in Fig. 2 were determined by qRT-PCR and normalized to mouse tubulin gene in the same sample. Insert represents mean ± SE, expressed as percent of control. ***p < 0.0001 vs. all other groups determined 2-way ANOVA (genotype by sex) and post hoc Fisher tests. (B) Western blot of proteins probed with antibodies against ATF3 and β-actin is shown in the upper panel. Quantification of ATF3 protein in brains (mean ± SE, n = 8/group) is expressed relative to control levels in the lower panel. **p < 0.01 vs. control determined by unpaired Student t test. (C, D) Levels of ATF3 mRNA in the brains of APP/PS1 mice plotted as a function of CCL4 mRNA levels (C) and amount of insoluble amyloid-β 1–42 (Aβ1–42) (D). The p values were determined by correlation z-test. (E) Confocal immunofluorescence images showing greater cellular expression of ATF3 (green) in the hippocampus of an APP/PS1 mouse vs. a control mouse. DAPI, shown as blue; scale bars = 20 μm.
Figure 5
Figure 5
Cellular colocalization of activating transcription factor 3 (ATF3)-positive cells with CCL4 and glial fibrillary acidic protein (GFAP) in APP/PS1 mouse brain. Brain sections from APP/PS1 mice were immunolabelled with primary antibody against ATF3 (green) combined with antibodies against either CCL4 (chemokine-specific, red), GFAP (astrocyte-specific, red) or NeuN (neuronal-specific, red). Confocal double stained immunofluorescence images showing ATF3-positive cells (green), colocalized (yellow) with CCL4 (upper row) and GFAP (middle row), but not with NeuN (lower row), indicating that ATF3-postive cells are predominantly glial. DAPI, shown as blue; scale bars = 20 μm.
Figure 6
Figure 6
Activating transcription factor 3 (ATF3) gene methylation status and correlation with gene transcription. (A) The amount of methylated ATF3 gene was quantified by real-time qPCR using remaining input DNA after cleavage with a methylation sensitive and methylation-dependent restriction enzyme. Data are mean ± SE, n = 6–15/group, expressed as percent of methylated CpG sites on the ATF3 promoter. *p < 0.05 vs. control determined by unpaired Student t test. (B, C) Correlation of methylated CpG sites on the ATF3 promoter region with expression of mRNAs for ATF3 (B) and CCL4 (C), with indicated linear regression lines. The p values were determined by correlation z-test.

References

    1. Gorelick PB. Role of inflammation in cognitive impairment: results of observational epidemiological studies and clinical trials. Ann N Y Acad Sci. 2010;1207:155–62. - PubMed
    1. Perry VH, Cunningham C, Holmes C. Systemic infections and inflammation affect chronic neurodegeneration. Nat Rev Immunol. 2007;7:161–7. - PubMed
    1. Minagar A, Shapshak P, Fujimura R, et al. The role of macrophage/microglia and astrocytes in the pathogenesis of three neurologic disorders: HIV-associated dementia, Alzheimer disease, and multiple sclerosis. J Neurol Sci. 2002;202:13–23. - PubMed
    1. Schmidtmayerova H, Nottet HS, Nuovo G, et al. Human immunodeficiency virus type 1 infection alters chemokine beta peptide expression in human monocytes: implications for recruitment of leukocytes into brain and lymph nodes. Proceedings of the National Academy of Sciences of the United States of America. 1996;93:700–4. - PMC - PubMed
    1. Kelder W, McArthur JC, Nance-Sproson T, et al. Beta-chemokines MCP-1 and RANTES are selectively increased in cerebrospinal fluid of patients with human immunodeficiency virus-associated dementia. Ann Neurol. 1998;44:831–5. - PubMed

Publication types

MeSH terms