

Plasma phospholipids identify antecedent memory impairment in older adults
- PMID: 24608097
- PMCID: PMC5360460
- DOI: 10.1038/nm.3466
Plasma phospholipids identify antecedent memory impairment in older adults
Abstract
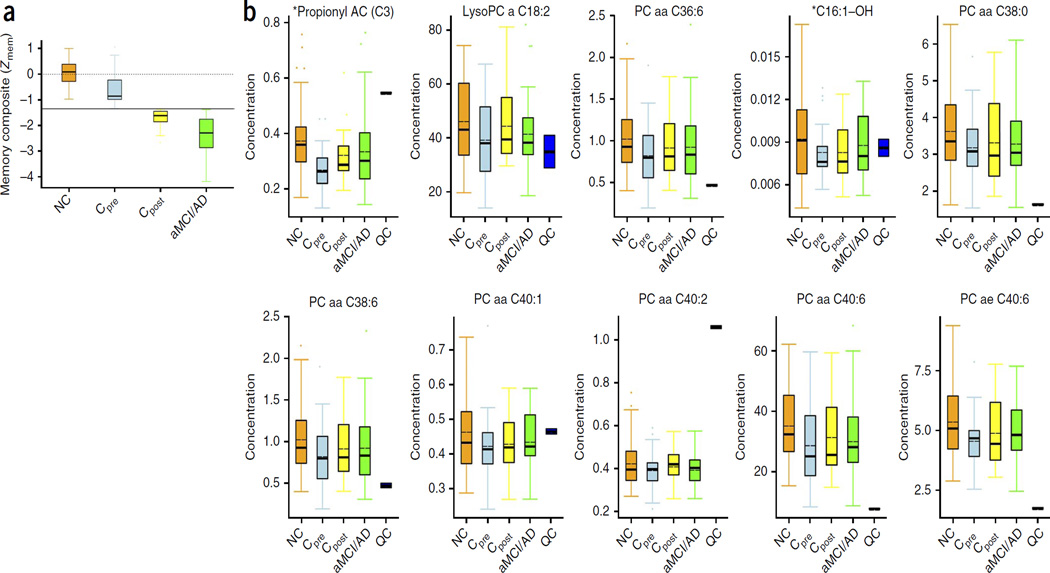
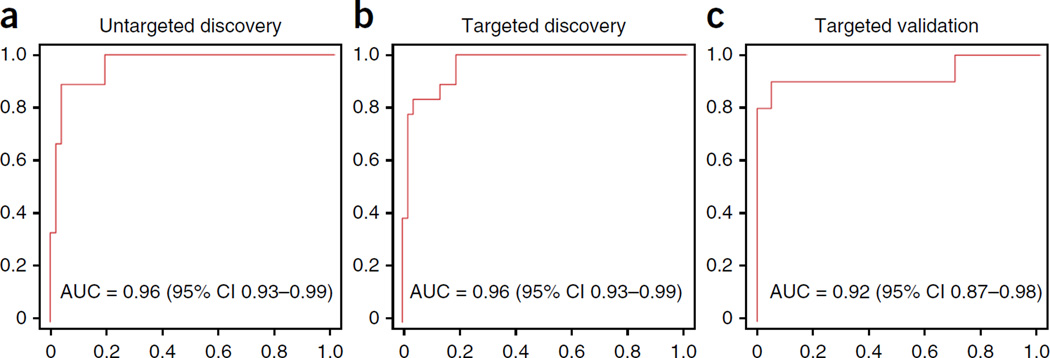
Alzheimer's disease causes a progressive dementia that currently affects over 35 million individuals worldwide and is expected to affect 115 million by 2050 (ref. 1). There are no cures or disease-modifying therapies, and this may be due to our inability to detect the disease before it has progressed to produce evident memory loss and functional decline. Biomarkers of preclinical disease will be critical to the development of disease-modifying or even preventative therapies. Unfortunately, current biomarkers for early disease, including cerebrospinal fluid tau and amyloid-β levels, structural and functional magnetic resonance imaging and the recent use of brain amyloid imaging or inflammaging, are limited because they are either invasive, time-consuming or expensive. Blood-based biomarkers may be a more attractive option, but none can currently detect preclinical Alzheimer's disease with the required sensitivity and specificity. Herein, we describe our lipidomic approach to detecting preclinical Alzheimer's disease in a group of cognitively normal older adults. We discovered and validated a set of ten lipids from peripheral blood that predicted phenoconversion to either amnestic mild cognitive impairment or Alzheimer's disease within a 2-3 year timeframe with over 90% accuracy. This biomarker panel, reflecting cell membrane integrity, may be sensitive to early neurodegeneration of preclinical Alzheimer's disease.
Figures
Comment in
-
Blood test can predict Alzheimer's disease, say US scientists.BMJ. 2014 Mar 10;348:g2074. doi: 10.1136/bmj.g2074. BMJ. 2014. PMID: 24620352 No abstract available.
-
Peril beyond the winner's curse: A small sample size is the bane of biomarker discovery.Alzheimers Dement. 2017 May;13(5):606-607. doi: 10.1016/j.jalz.2017.01.003. Epub 2017 Jan 21. Alzheimers Dement. 2017. PMID: 28119051 No abstract available.
References
-
- World Health Organization. Dementia: a Public Health Priority. Geneva: World Health Organization; 2012.
-
- Sperling RA, et al. Toward defining the preclinical stages of Alzheimer’s disease: recommendations from the National Institute on Aging-Alzheimer’s Association workgroups on diagnostic guidelines for Alzheimer’s disease. Alzheimer’s & Dementia: the Journal of the Alzheimer’s Association. 2011;7:280–292. - PMC - PubMed
-
- Hulstaert F, et al. Improved discrimination of AD patients using β-amyloid(1–42) and tau levels in CSF. Neurology. 1999;52:1555–1562. - PubMed
-
- Small SA, Perera GM, De La Paz R, Mayeux R, Stern Y. Differential regional dysfunction of the hippocampal formation among elderly with memory decline and Alzheimer’s disease. Ann. Neurol. 1999;45:466–472. - PubMed
-
- Klunk WE, et al. Imaging brain amyloid in Alzheimer’s disease with Pittsburgh Compound-B. Ann. Neurol. 2004;55:306–319. - PubMed
Publication types
MeSH terms
Substances
Grants and funding
LinkOut - more resources
Full Text Sources
Other Literature Sources
Medical
