. 2014 Jul;21(7):1119-31.
doi: 10.1038/cdd.2014.31. Epub 2014 Mar 7.

Conversion of differentiated cancer cells into cancer stem-like cells in a glioblastoma model after primary chemotherapy

Affiliations

Conversion of differentiated cancer cells into cancer stem-like cells in a glioblastoma model after primary chemotherapy

B Auffinger et al. Cell Death Differ. 2014 Jul.

Abstract

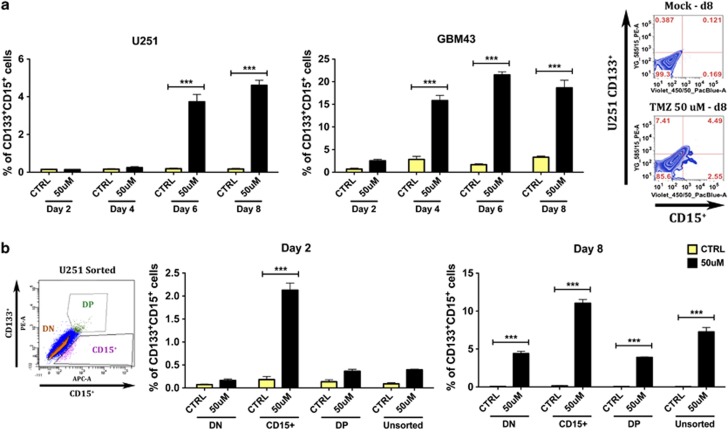
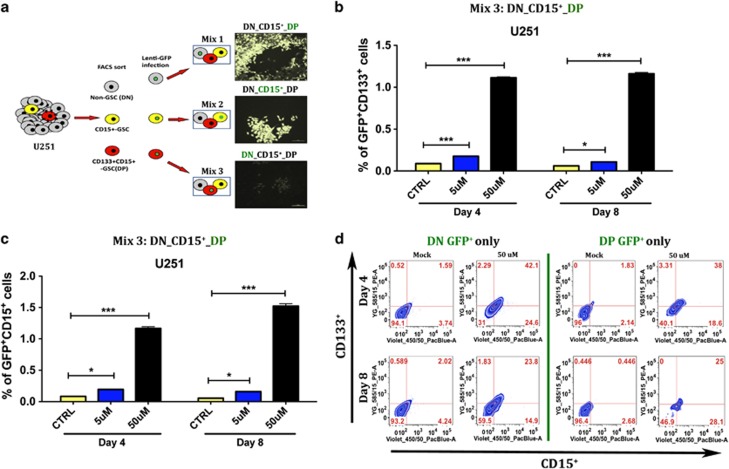
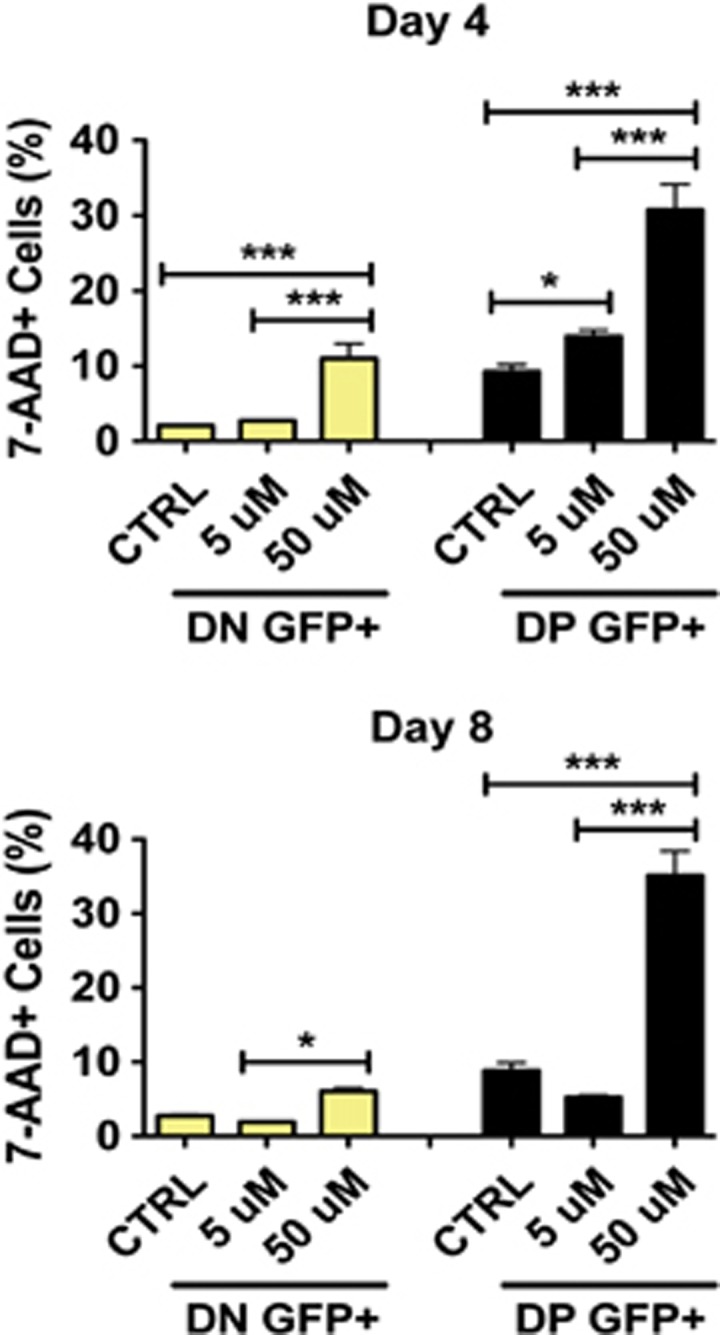
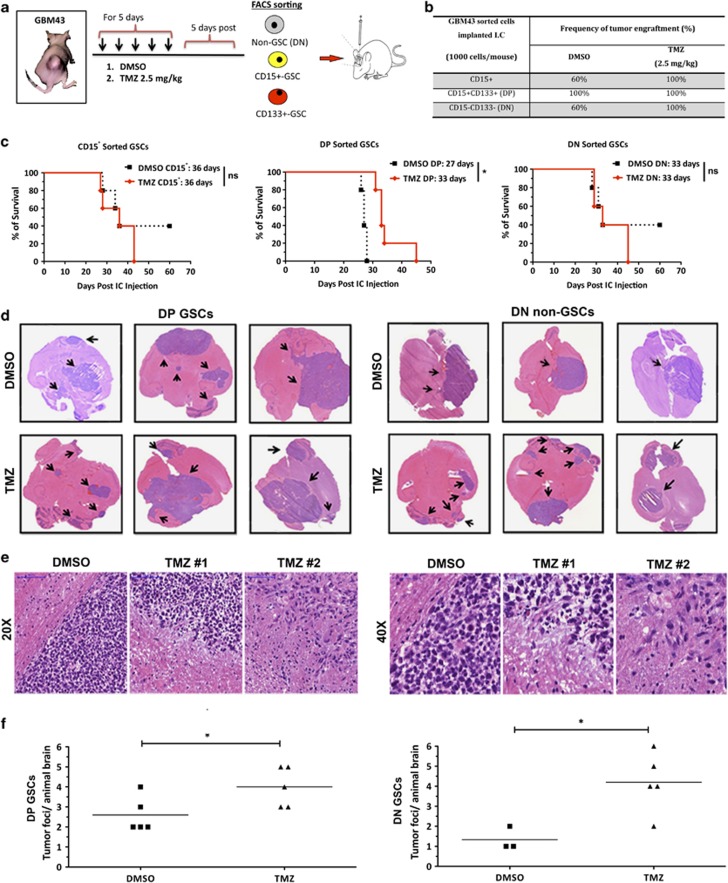
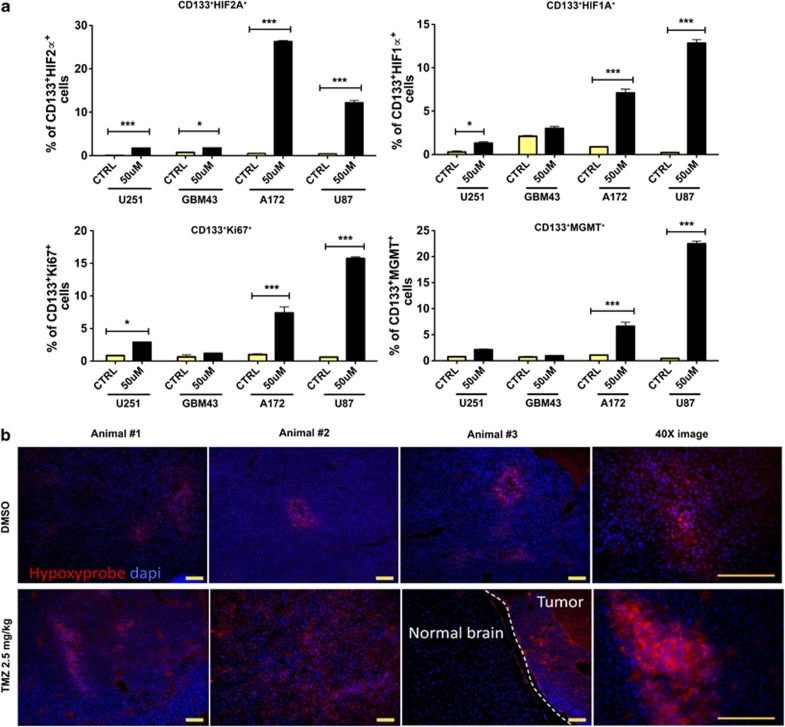
Glioblastoma multiforme patients have a poor prognosis due to therapeutic resistance and tumor relapse. It has been suggested that gliomas are driven by a rare subset of tumor cells known as glioma stem cells (GSCs). This hypothesis states that only a few GSCs are able to divide, differentiate, and initiate a new tumor. It has also been shown that this subpopulation is more resistant to conventional therapies than its differentiated counterpart. In order to understand glioma recurrence post therapy, we investigated the behavior of GSCs after primary chemotherapy. We first show that exposure of patient-derived as well as established glioma cell lines to therapeutic doses of temozolomide (TMZ), the most commonly used antiglioma chemotherapy, consistently increases the GSC pool over time both in vitro and in vivo. Secondly, lineage-tracing analysis of the expanded GSC pool suggests that such amplification is a result of a phenotypic shift in the non-GSC population to a GSC-like state in the presence of TMZ. The newly converted GSC population expresses markers associated with pluripotency and stemness, such as CD133, SOX2, Oct4, and Nestin. Furthermore, we show that intracranial implantation of the newly converted GSCs in nude mice results in a more efficient grafting and invasive phenotype. Taken together, these findings provide the first evidence that glioma cells exposed to chemotherapeutic agents are able to interconvert between non-GSCs and GSCs, thereby replenishing the original tumor population, leading to a more infiltrative phenotype and enhanced chemoresistance. This may represent a potential mechanism for therapeutic relapse.


Figures

Figure 1
Figure 1
Representative FACS plot characterizing our newly formed stem-like cells 8 days post-initial TMZ therapy in four human-derived as well as established glioma cell lines. (a) There is a consistent and significant increase of classical CSC markers (CD133, CD15, Sox2, and Oct4) post-TMZ therapy. These results are extendable to at least three out of four glioma cell lines and xenografted specimens studied, except Oct4, which is overexpressed in two out four cell lines and xenografts. (b) The expression of double-positive markers has been selected in order to allow a more reliable categorization. There was a significant increase in GSCs co-expressing both CD133 and CD15 markers. This increase is also observed for the co-expression of CD133 and Sox-2 and CD133 and Oct4. This last combination was not significantly increased in GBM43 xenografts (P: ns). The control group (CTRL) received DMSO. Error bars denote S.E.M. P: ns (P>0.05), *P<0.05, **P<0.01, ***P<0.001, one-way analysis of variance
Figure 2
Figure 2
Clinically relevant doses of temozolomide cause a significant increase in the GSC pool in vitro. Such an increase is originated from either the amplification of the GSC population or the conversion of non-GSCs into GSCs. FACS analysis of sorted and unsorted glioma cells treated with either DMSO or 50 μM of TMZ for 8 days. (a) The increase in the GSC population happens over time and in a time-dependent manner in all tested cell lines (figure depicting U251 cell line and GBM43-xenografted specimen). (b) This finding holds true for both unsorted and sorted (DN, CD15+, and DP) U251 populations. We observed a maximum increase in the GSC population 8 days post-initial TMZ therapy. There are both an amplification of GSCs and a conversion of DN non-GSCs into single-positive or double-positive GSCs. DN: FACS-sorted non-GSCs expressing double-negative markers (CD133CD15), CD15+: sorted GSCs expressing only the CD15 marker, DP: sorted GSCs expressing double-positive markers (CD133+CD15+). Error bars denote S.E.M. P: ns (P>0.05), *P<0.05, **P<0.01, ***P<0.001, one-way analysis of variance
Figure 3
Figure 3
Graphic representation of the increase in the GSC pool post-TMZ therapy in unsorted U251 glioma cells with GFP-tagged subpopulations (DN, CD15+, and DP). (a) Figure depicting the experiment set up with tagged GSC and non-GSC subpopulations. As there is no consensus on an optimal and most representative GSC marker, we used various single and combined markers to ratify our observations. (b) Plot depicting amplification of DP (GFP+) GSCs into CD133+ GSCs. TMZ triggered an amplification of the GFP-tagged CD133+ GSCs (GFP+CD133+) over time and in a dose-dependent manner (both with 5 and 50 μM of TMZ). Mock cells present a typical fluctuation in the GSC markers, with very low rates of GSCs (∼0.093%). The TMZ-triggered amplification of the GFP-tagged tumor cells aims to replenish the previously depleted GSC population, raising it to ∼1.16% at 8 days post-TMZ therapy (50 μM). (c) Similar representation showing the amplification of the DP GSC population (GFP-tagged). Now such amplification is measured by an increase in single-positive CD15 GSC markers. (d) Both unsorted DN (first column) and DP (second column) U251 GFP-tagged cells show an increase in the GSC population at 4 and 8 days post-initial TMZ therapy. Here we look for the presence of double-positive (CD133+CD15+) GSC markers. We see both a significant conversion of non-GSCs into DP GSCs (P<0.001) and an amplification of the DP GSCs (P<0.001). P-values represent the average of at least five samples, P: ns (P>0.05), *P<0.05, ***P<0.001, one-way analysis of variance
Figure 4
Figure 4
Therapeutic doses of temozolomide can deplete the pre-existing GSC pool. FACS analysis of the GFP-tagged (GFP+) DN (CD133CD15) non-GSC and DP (CD133+CD15+) GSC populations. Cell viability was assessed by 7-AAD staining. Although DN cells are killed by TMZ treatment, there is no preferential death of the DN non-GSC population upon long-term TMZ therapy (either on day 4 (∼12%) or 8 (∼7%)). DP GFP+ cells seem to be more vulnerable to TMZ therapy (∼33% of 7-AAD+ cells 8 days post-initial therapy). Error bars denote S.E.M. P: ns (P>0.05), *P<0.05, **P<0.01, ***P<0.001, one-way analysis of variance
Figure 5
Figure 5
The effects of temozolomide on GSCs in vivo (human-derived GBM43 flank model). (a) Figure describing in vivo experiment set up. GBM43 tumors were implanted in the flank of athymic nude mice and treated for 5 consecutive days with different doses of TMZ (2.5, 5, and 10 mg/kg/day) or DMSO. Five days post-therapy tumors were collected, measured, weighed, and analyzed using FACS and immunofluorescence staining. (b) Representative plot depicting the relative tumor volume over time (during the 10 days post-initial therapy). In addition, there is a representation of tumor measure post collection. TMZ treatment was able to cause tumor shrinkage under all conditions and in a dose-dependent manner. (c) FACS analysis of the GSC population in the collected tumors. Suboptimal doses of TMZ (2.5 mg/kg/day) consistently and significantly triggered the highest increase in the GSC population when compared with the control group. This observation was true for the CD133+, (d) CD15+, and (e) Sox-2+ GSC populations. (f) Immunofluorescence staining ( × 20 magnification) with double-positive GSC markers (CD133/Sox2) reaffirmed the above findings. (g) Frequency of CD133, CD133/CD15, and CD133/Sox2 markers in GBM12, GBM26, and GBM39 flank tumors treated with or without TMZ (2.5 mg/kg/day). Error bars represent S.D. from the average of at least five samples. Error bars denote S.E.M. P: ns (P>0.05), *P<0.05, **P<0.01, ***P<0.001, one-way analysis of variance
Figure 6
Figure 6
The effects of temozolomide on GSCs and tumor engraftment in vivo (human-derived GBM43 intracranial model). (a) Figure describing in vivo experiment set up. GBM43 tumors were implanted in the flank of athymic nude mice and treated for 5 consecutive days with 2.5 mg/kg/day of TMZ or DMSO (five animals/group). Five days post-therapy tumors were collected and disaggregated, and glioma cells were immediately FACS-sorted for DN (CD133CD15) non-GSCs, CD15+ GSCs, and DP (CD15+CD133+) GSCs. The sorted populations were orthotopically implanted in the brain of athymic nude mice and (b) frequency of tumor engraftment and (c) animal survival were observed. The Kaplan–Meier survival plots show that mice intracranially injected with DN non-GSCs previously treated with TMZ presented similar survival rates as those that received TMZ-treated GSCs. P-values were calculated using the log-rank test. (d and e) We also analyzed the histological characteristics and (f) the frequency of extra-tumor foci by H&E staining in both DP and DN populations. There was a consistently higher infiltrative and invasive phenotype in xenografts derived from both non-GSCs and GSCs previously treated with TMZ. The mice brains that received TMZ-treated cells displayed a significantly higher (P<0.05) number of extra-tumor foci when compared with the control groups. Error bars represent S.D. from the average of at least five samples. P: ns (P>0.05), *P<0.05, **P<0.01, ***P<0.001, unpaired t-test
Figure 7
Figure 7
Temozolomide-associated increment of HIFs may control GSC maintenance and tumorigenesis. (a) Serial analysis of all four cell lines used throughout this study indicated significantly increased levels of HIF2α in CD133+ GSCs in four out of four glioma cell lines. The same was true for HIF1α and Ki67, a well-known marker of cell proliferation. Additional analysis revealed that only two out of four studied cell lines possessed CD133+ GSCs that expressed MGMT, a DNA repair protein. (b) Hypoxyprobe staining identifying hypoxic areas within GBM43 brain tumors. TMZ-treated tumors presented more hypoxic regions than the non-treated group. Fluorescent images were captured using the × 10 and × 40 objectives. Error bars denote S.E.M. P: ns (P>0.05), *P<0.05, **P<0.01, ***P<0.001, one-way analysis of variance

References

    1. Stupp R, Mason WP, van den Bent MJ, Weller M, Fisher B, Taphoorn MJ, et al. Radiotherapy plus concomitant and adjuvant temozolomide for glioblastoma. N Engl J Med. 2005;352:987–996. - PubMed
    1. Hau P, Koch D, Hundsberger T, Marg E, Bauer B, Rudolph R, et al. Safety and feasibility of long-term temozolomide treatment in patients with high-grade glioma. Neurology. 2007;68:688–690. - PubMed
    1. Chen J, Li Y, Yu TS, McKay RM, Burns DK, Kernie SG, et al. A restricted cell population propagates glioblastoma growth after chemotherapy. Nature. 2012;488:522–526. - PMC - PubMed
    1. Bleau AM, Hambardzumyan D, Ozawa T, Fomchenko EI, Huse JT, Brennan CW, et al. PTEN/PI3K/Akt pathway regulates the side population phenotype and ABCG2 activity in glioma tumor stem-like cells. Cell Stem Cell. 2009;4:226–235. - PMC - PubMed
    1. Beier D, Schulz JB, Beier CP. Chemoresistance of glioblastoma cancer stem cells—much more complex than expected. Mol cancer. 2011;10:128. - PMC - PubMed

Publication types

MeSH terms

Substances