. 2014 Mar 7;9(3):e91424.
doi: 10.1371/journal.pone.0091424. eCollection 2014.

Cortical depth dependence of the diffusion anisotropy in the human cortical gray matter in vivo

Affiliations

Cortical depth dependence of the diffusion anisotropy in the human cortical gray matter in vivo

Trong-Kha Truong et al. PLoS One. .

Abstract

Diffusion tensor imaging (DTI) is typically used to study white matter fiber pathways, but may also be valuable to assess the microstructure of cortical gray matter. Although cortical diffusion anisotropy has previously been observed in vivo, its cortical depth dependence has mostly been examined in high-resolution ex vivo studies. This study thus aims to investigate the cortical depth dependence of the diffusion anisotropy in the human cortex in vivo on a clinical 3 T scanner. Specifically, a novel multishot constant-density spiral DTI technique with inherent correction of motion-induced phase errors was used to achieve a high spatial resolution (0.625 × 0.625 × 3 mm) and high spatial fidelity with no scan time penalty. The results show: (i) a diffusion anisotropy in the cortical gray matter, with a primarily radial diffusion orientation, as observed in previous ex vivo and in vivo studies, and (ii) a cortical depth dependence of the fractional anisotropy, with consistently higher values in the middle cortical lamina than in the deep and superficial cortical laminae, as observed in previous ex vivo studies. These results, which are consistent across subjects, demonstrate the feasibility of this technique for investigating the cortical depth dependence of the diffusion anisotropy in the human cortex in vivo.


Conflict of interest statement

Competing Interests: The authors have declared that no competing interests exist.

Figures

Figure 1
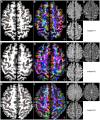
Figure 1. DTI results.
Maps of the FA (A,F,K), DEC (B,G,L), axial diffusivity (C,H,M), and radial diffusivity (D,I,N) and T1-weighted anatomical images (E,J,O) for three different subjects. The FA and DEC maps are scaled from 0 to 0.3 to highlight the FA variations within the cortical GM and the diffusivity maps are scaled from 0 to 2×10⁻³ mm2/s. The arrowheads in (A,B,F,G,K,L) show a band of low FA in the deep cortical lamina. The numbers in (A,F,K) refer to the ROIs used in Figs. 5 and 7.
Figure 2
Figure 2. Principal diffusion direction for subject #1.
Color-coded map of the principal eigenvector (A), FA map (B), and T1-weighted anatomical image (C) in the same slice as that shown in Figs. 1A–E. The green and red arrowheads show cortical GM regions with a primarily radial principal diffusion direction.
Figure 3
Figure 3. Principal diffusion direction for subject #2.
Color-coded map of the principal eigenvector (A), FA map (B), and T1-weighted anatomical image (C) in the same slice as that shown in Figs. 1F–J. The green and red arrowheads show cortical GM regions with a primarily radial principal diffusion direction, whereas the yellow arrowhead shows a cortical GM region with a primarily tangential principal diffusion direction.
Figure 4
Figure 4. Principal diffusion direction for subject #3.
Color-coded map of the principal eigenvector (A), FA map (B), and T1-weighted anatomical image (C) in the same slice as that shown in Figs. 1K–O. The green and red arrowheads show cortical GM regions with a primarily radial principal diffusion direction, whereas the yellow arrowhead shows a cortical GM region with a primarily tangential principal diffusion direction.
Figure 5
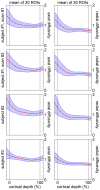
Figure 5. Cortical profiles of the FA.
FA (mean ± standard deviation) as a function of the cortical depth. The solid lines were computed with cubic spline interpolation. The dashed lines denote the pial surface and the GM/WM interface at a cortical depth of 0% and 100%. The first four columns show the cortical profiles in the representative ROIs shown in Figs. 1A,F,K, whereas the last column shows the mean cortical profiles averaged over 20 ROIs. The first two rows show results from identical experiments performed on the same subject on two different days. The arrows show a local maximum in the middle cortical lamina and a local minimum in the deep cortical lamina.
Figure 6
Figure 6. Cortical profiles of the diffusivity.
Axial and radial diffusivity (mean ± standard deviation in 10−3 mm2/s) as a function of the cortical depth. The solid lines were computed with cubic spline interpolation. The dashed lines denote the pial surface and the GM/WM interface at a cortical depth of 0% and 100%. Both columns show the mean cortical profiles averaged over 20 ROIs. The first two rows show results from identical experiments performed on the same subject on two different days.
Figure 7
Figure 7. Cortical profiles of the radiality index.
Radiality index (mean ± standard deviation; 1 = radial, 0 = tangential) as a function of the cortical depth. The solid lines were computed with cubic spline interpolation. The dashed lines denote the pial surface and the GM/WM interface at a cortical depth of 0% and 100%. The first four columns show the cortical profiles in the representative ROIs shown in Figs. 1A,F,K, whereas the last column shows the mean cortical profiles averaged over 20 ROIs. The first two rows show results from identical experiments performed on the same subject on two different days.

References

    1. Kroenke CD, Van Essen DC, Inder TE, Rees S, Bretthorst GL, et al. (2007) Microstructural changes of the baboon cerebral cortex during gestational development reflected in magnetic resonance imaging diffusion anisotropy. J Neurosci 27: 12506–12515. - PMC - PubMed
    1. Bock AS, Olavarria JF, Leigland LA, Taber EN, Jespersen SN, et al. (2010) Diffusion tensor imaging detects early cerebral cortex abnormalities in neuronal architecture induced by bilateral neonatal enucleation: an experimental model in the ferret. Front Syst Neurosci 4: 149. - PMC - PubMed
    1. Takahashi E, Dai G, Wang R, Ohki K, Rosen GD, et al. (2010) Development of cerebral fiber pathways in cats revealed by diffusion spectrum imaging. NeuroImage 49: 1231–1240. - PMC - PubMed
    1. Thornton JS, Ordidge RJ, Penrice J, Cady EB, Amess PN, et al. (1997) Anisotropic water diffusion in white and gray matter of the neonatal piglet brain before and after transient hypoxia-ischaemia. Magn Reson Imaging 15: 433–440. - PubMed
    1. Sizonenko SV, Camm EJ, Garbow JR, Maier SE, Inder TE, et al. (2007) Developmental changes and injury induced disruption of the radial organization of the cortex in the immature rat brain revealed by in vivo diffusion tensor MRI. Cereb Cortex 17: 2609–2617. - PMC - PubMed

Publication types

LinkOut - more resources