. 2014 Aug;134(8):2138-2145.
doi: 10.1038/jid.2014.127. Epub 2014 Mar 7.

High Rhodotorula sequences in skin transcriptome of patients with diffuse systemic sclerosis

Affiliations

High Rhodotorula sequences in skin transcriptome of patients with diffuse systemic sclerosis

Sarah T Arron et al. J Invest Dermatol. 2014 Aug.

Abstract

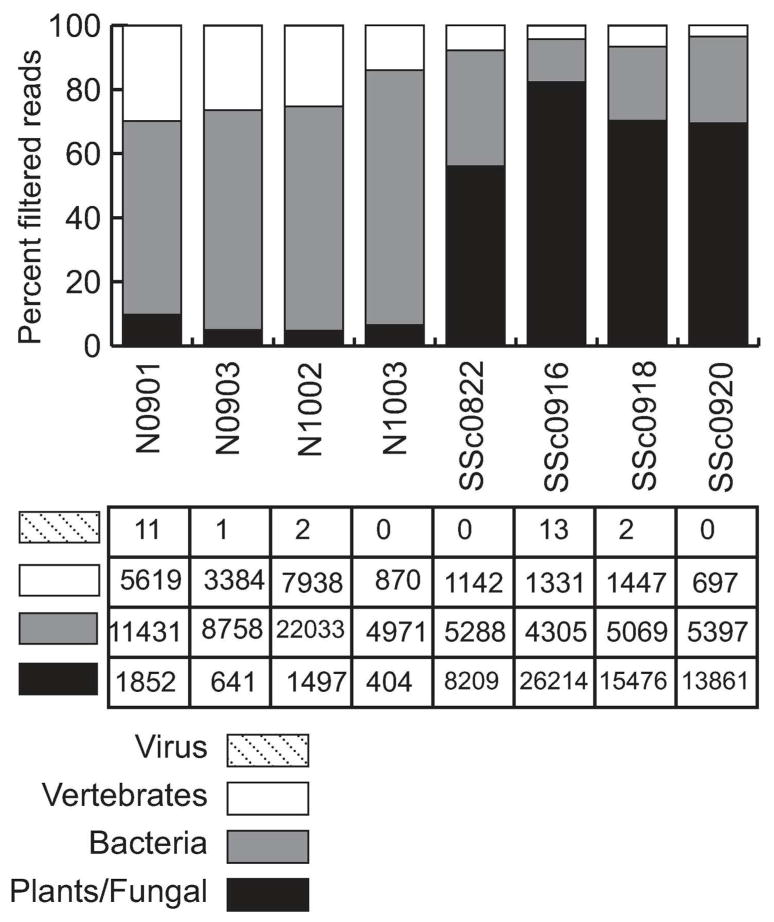
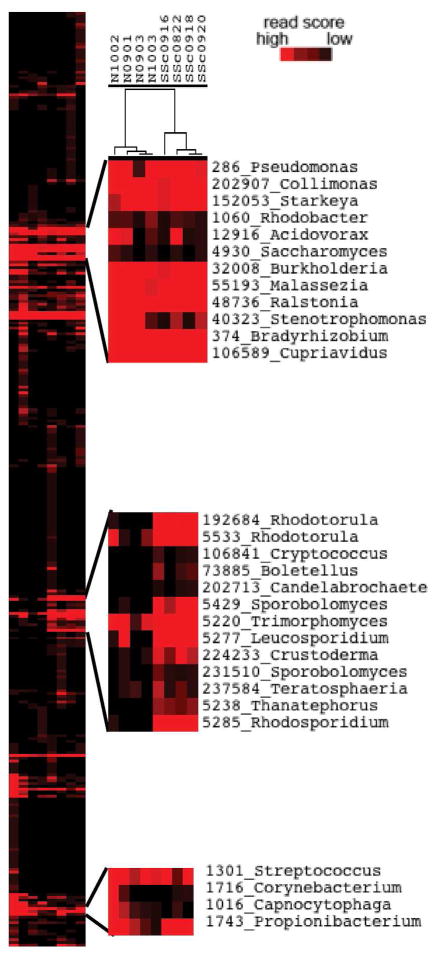
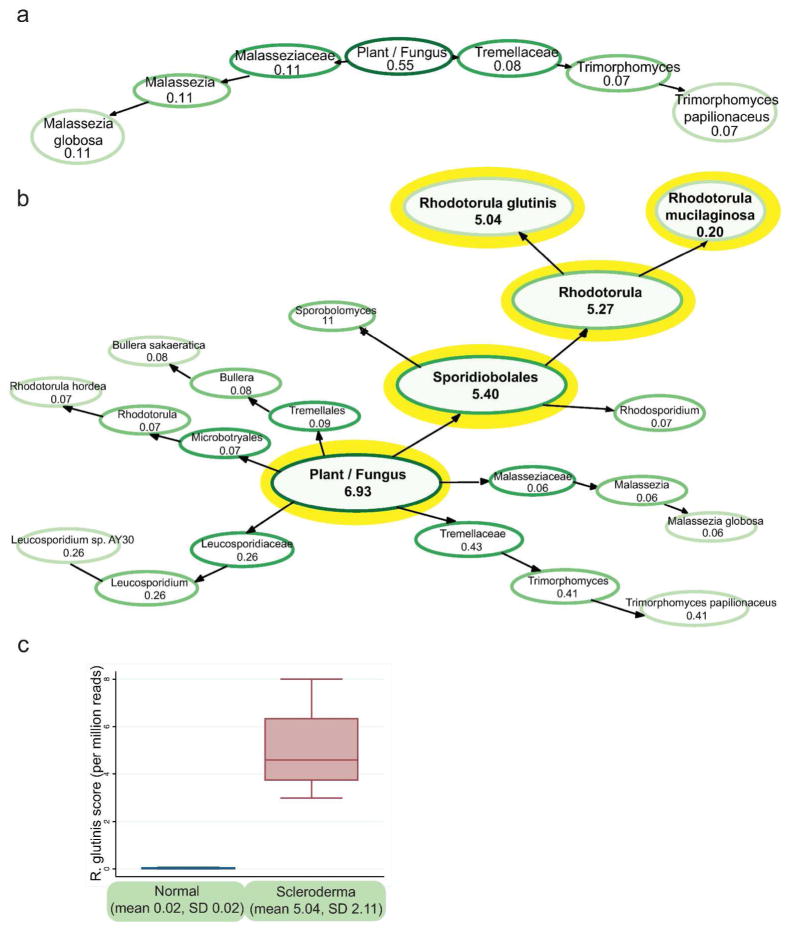
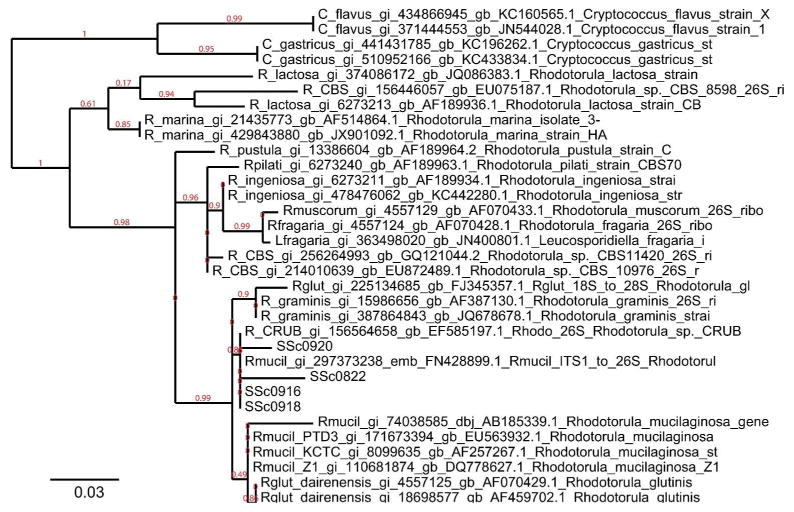
Previous studies have suggested a role for pathogens as a trigger of systemic sclerosis (SSc), although neither a pathogen nor a mechanism of pathogenesis is known. Here we show enrichment of Rhodotorula sequences in the skin of patients with early, diffuse SSc compared with that in normal controls. RNA-seq was performed on four SSc patients and four controls, to a depth of 200 million reads per patient. Data were analyzed to quantify the nonhuman sequence reads in each sample. We found little difference between bacterial microbiome and viral read counts, but found a significant difference between the read counts for a mycobiome component, R. glutinis. Normal samples contained almost no detected R. glutinis or other Rhodotorula sequence reads (mean score 0.021 for R. glutinis, 0.024 for all Rhodotorula). In contrast, SSc samples had a mean score of 5.039 for R. glutinis (5.232 for Rhodotorula). We were able to assemble the D1-D2 hypervariable region of the 28S ribosomal RNA (rRNA) of R. glutinis from each of the SSc samples. Taken together, these results suggest that R. glutinis may be present in the skin of early SSc patients at higher levels than in normal skin, raising the possibility that it may be triggering the inflammatory response found in SSc.


Conflict of interest statement

Conflict of Interest

Dr. Whitfield has filed patents for gene expression biomarkers in systemic sclerosis and is a scientific founder of Celdara Medical LLC. The remaining authors declare no conflict of interest.

Figures

Figure 1
Figure 1. IMSA analysis reveals plant/fungal sequences in SSc samples
Division-level breakdown of the reads remaining after filtering human reads. NCBI divisions group plants and fungal sequences together. Normal samples begin with “N” while SSc samples begin with “SSc”. Numbers shown in the table below are the IMSA score for each division per million input reads, indicating the relative abundance as a proportion of total reads. The most striking difference between normal and SSc samples is the abundance of plant/fungal reads in SSc samples, with an associated reduction in other divisions. Vertebrate reads (primarily human reads not filtered by IMSA due to mismatches to the human genome) are about a quarter of the non-plant/fungal reads. The other three-quarters of the non-plant/fungal reads are bacteria, the amount of which varies by sample but does not have a clear difference in abundance between normal and SSc samples.
Figure 2
Figure 2. Unsupervised clustering of genera scores
All bacterial, fungal and virual genera with a score above 0.01 in at least 1 sample were clustered by IMSA score, normalized per million reads in the original read set. The tree shows normal samples cluster together on the left while SSc samples cluster together on the right. The top and bottom call-outs show normal skin flora expressed in both normal and SSc samples. The center call-out shows fungal genera expressed predominantly in SSc samples.
Figure 3
Figure 3. Rhodotorula glutinis in Normal and SSc skin samples
a. TaxMap visualization of plant/fungal reads shows few fungal species in normal skin. TaxMaps show the IMSA score for each level of the taxonomic hierarchy, allowing quick visualization of the metagenome of a sample. The score shown is the average score for the normal samples counting only reads with a single best alignment, normalized per million input reads. Only nodes with a value above 0.05 are shown to make the figure easier to read. b. TaxMap visualization demonstrates R. glutinis as the dominant species in SSc skin. c. Reads with a single best alignment to R glutinis are present at 252-fold higher frequency in SSc skin than normal skin.
Figure 4
Figure 4. Phylogenetic tree of assembled 28S rRNA sequences
Phylogenetic tree of 28S rRNA sequences from selected NCBI Rhodotorula sequences. The maximum likelihood tree was constructed with PhyML and rendered with TreeDyn. Species names and accession numbers are given for sequences downloaded from GenBank. The four SSc samples are grouped with R. mucilaginosa, close to sequences from R. glutinis and R. graminis.
Figure 5
Figure 5. IGV visualization of original read set to R. glutinis 28S rRNA
Aligning raw reads to R. glutinis 28S rRNA sequence (FJ345357) shows many reads aligning in the SSc samples but much fewer reads in the normal samples. The position shown is from 750–1100 in the sequence, which is the end of ITS2 and the first 400 bases of 28S rRNA. The gray histogram shows the depth of coverage at each base along the sequence; note that the axis is 10-fold higher for SSc samples. Colored bars show areas where the aligned reads differ from the reference sequence.

References

    1. Alvarez-Fernández JA, Quirce S, Calleja JL, et al. Hypersensitivity pneumonitis due to an ultrasonic humidifier. Allergy. 1998;53:210–2. - PubMed
    1. Biswas SK, Yokoyama K, Nishimura K, et al. Molecular phylogenetics of the genus Rhodotorula and related basidiomycetous yeasts inferred from the mitochondrial cytochrome b gene. Int J Syst Evol Microbiol. 2001;51:1191–9. - PubMed
    1. Chung L, Fiorentino DF, Benbarak MJ, et al. Molecular framework for response to imatinib mesylate in systemic sclerosis. Arthritis Rheum. 2009;60:584–91. - PMC - PubMed
    1. Dereeper A, Guignon V, Blanc G, et al. Phylogeny.fr: robust phylogenetic analysis for the nonspecialist. Nucleic Acids Res. 2008;36:W465–469. - PMC - PubMed
    1. Dimon MT, Wood HM, Rabbitts PH, et al. IMSA: integrated metagenomic sequence analysis for identification of exogenous reads in a host genomic background. PLoS ONE. 2013;8:e64546. - PMC - PubMed

Publication types

Substances

LinkOut - more resources