

doi: 10.1007/s13244-014-0323-7.
Epub 2014 Mar 8.
Small (<1 cm) incidental echogenic renal cortical nodules: chemical shift MRI outperforms CT for confirmatory diagnosis of angiomyolipoma (AML)
Affiliations
- PMID: 24609721
- PMCID: PMC4035486
- DOI: 10.1007/s13244-014-0323-7
Item in Clipboard
Small (<1 cm) incidental echogenic renal cortical nodules: chemical shift MRI outperforms CT for confirmatory diagnosis of angiomyolipoma (AML)
Insights Imaging.
2014 Jun.
No abstract available
Figures

Diagnostic algorithms for incidentally detected echogenic renal cortical nodules. a For nodules >1 cm in size, definitive characterisation with CT or MRI to confirm the presence of gross fat and the diagnosis of AML is widely accepted. b For nodules <1 cm in size, management varies and is controversial. Options include: doing nothing, sonographic follow-up to confirm stability in size or CT to confirm the presence of gross fat and the diagnosis of AML. In our experience, the majority of nodules <1 cm in size cannot be further characterised with CT, which can lead to a variety of subsequent examinations including US or CT follow-up, contrast-enhanced CT or MRI. c In our opinion, the radiologist confronted with an incidental echogenic renal nodule measuring <1 cm in size should consider either US follow-up to confirm stability, or if definitive characterisation is required, chemical shift MRI and not CT should be performed

A 45-year-old woman with incidental echogenic renal cortical nodule. Sagittal and transverse grey scale (a) and colour (b) images of the left kidney depict a homogeneously hyperechoic nodule in the lower pole (white arrows), which measures 10 × 12 × 14 mm in size. Axial contrast-enhanced CT image (b) confirms the presence of a low-density nodule in the lower pole of the left kidney that measures −42 HU, diagnostic of gross fat and AML. Axial T1-weighted in-phase (IP) (c), opposed-phase (OP) (d) and spectral fat suppressed (FS) (e) gradient recalled echo (GRE) images demonstrate that the AML is isointense to retroperitoneal fat on IP (solid black arrow in c) and demonstrates loss of with FS (open black arrow in e) also diagnostic of gross or mature fat. Similarly, gross fat is diagnosed on the OP (d) by noting “india ink” or “etching” artefact at the margin of the nodule and the adjacent kidney (black arrow) and the absence of etching artefact at the interface of the nodule with retroperitoneal fat (dotted arrow)
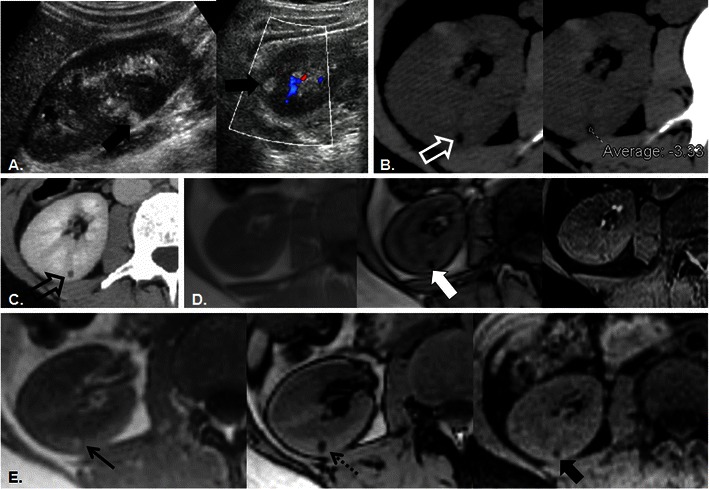
A 36-year-old man with incidental echogenic renal cortical nodule. Sagittal and transverse grey scale and colour (a) images of the right kidney depict a homogeneously hyperechoic nodule in the interpolar region (white arrows) which measures 8 × 6 × 6 mm in size. Axial unenhanced CT image (b) confirms the presence of a low-density nodule (open white arrow) with an ROI measurement of −3 HU. Pixel mapping was not performed and a follow-up CT was recommended. Six-month follow-up contrast-enhanced axial (c) CT image re-demonstrates the small renal cortical nodule (open white arrow), which is not changed in size but remains indeterminate; MRI was recommended. Axial T1-weighted IP, OP, and FS GRE images (left to right in d) reveal the renal nodule as a punctate focus of signal loss on OP image only (white arrow). The lesion was again considered indeterminate and follow-up was recommended. Axial T1-weighted IP, OP, and FS GRE images (left to right in e) performed 3 years later confirm the diagnosis of renal AML with persistent signal loss on the OP image (dotted arrow) and loss of signal intensity now noted on FS (thick black arrow) compared with IP (thin black arrow) T1-weighted images. In retrospect, the diagnosis was apparent on initial MRI examination (d); signal loss on OP imaging in uniformly echogenic nodules measuring <1 cm in size is confirmatory of AML

Schematic representation of renal AML diagnosis on OP MRI. In larger lesions (a) the presence of india ink artefact around a nodule embedded within the renal parenchyma is diagnostic of gross fat. If the nodule is extremely small (b), india ink artefact may obscure the entire lesion and the AML will appear only as a spot of signal loss within the renal parenchyma. Similarly, if the base voxel resolution is too large (c), india ink artefact may obscure the centre of the lesion so that the entire lesion appears as a signal loss. A clinical example illustrates these principles in a 38-year-old woman with tuberous sclerosis. A small (5 mm) AML is present in the upper pole of the right kidney on axial T1-weighted IP, OP, and FS GRE images (left to right in d). The AML is depicted as a focus of increased T1 signal intensity on IP (black arrow) with an etching artefact around its circumference on OP (open black arrow) imaging and which loses signal intensity with chemical fat suppression (white arrow). The lesion was only prospectively identified on the opposed phase image and was indeterminate at CT (not shown). In the same patient at a lower level (e), two tiny AML (<5 mm in size) in the lower pole of the left kidney are only prospectively identified as areas of signal loss on the opposed phase images (white arrows) but in retrospect also demonstrate signal intensity loss with fat suppression (dotted arrows). A similar phenomenon will be seen if a larger voxel size is used (see Fig. 3)
References
-
- Hajdu SI, Foote FW., Jr Angiomyolipoma of the kidney: report of 27 cases and review of the literature. J Urol. 1969;102:396–401. - PubMed
-
- Paivansalo M, Lahde S, Hyvarinen S, Kallioinen M, Jalovaara P. Renal angiomyolipoma. Ultrasonographic, CT, angiographic, and histologic correlation. Acta Radiol. 1991;32:239–243. - PubMed
LinkOut - more resources
Full Text Sources
Other Literature Sources
