

Dissecting the role of retinoic acid receptor isoforms in the CD8 response to infection
- PMID: 24610012
- PMCID: PMC4648262
- DOI: 10.4049/jimmunol.1301949
Dissecting the role of retinoic acid receptor isoforms in the CD8 response to infection
Abstract
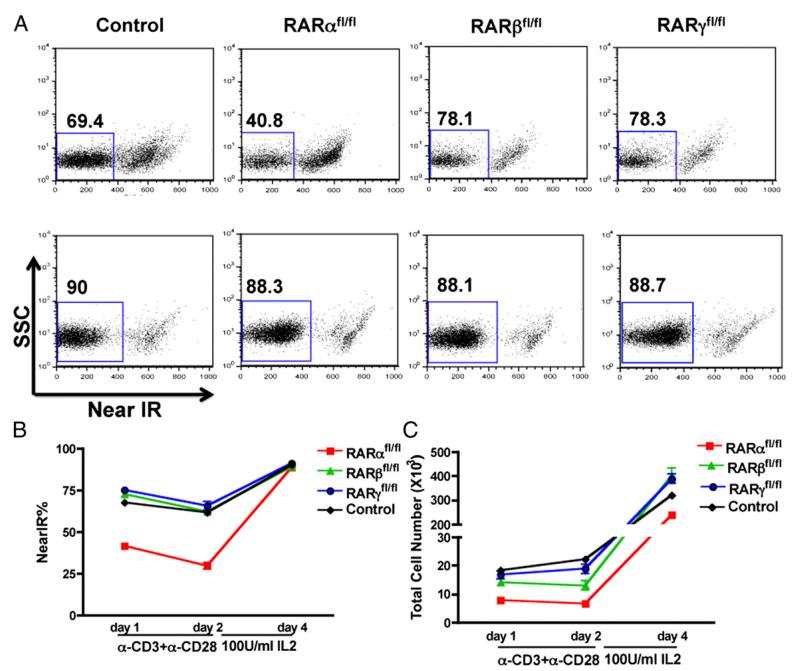
Vitamin A deficiency leads to increased susceptibility to a spectrum of infectious diseases. The studies presented dissect the intrinsic role of each of the retinoic acid receptor (RAR) isoforms in the clonal expansion, differentiation, and survival of pathogen-specific CD8 T cells in vivo. The data show that RARα is required for the expression of gut-homing receptors on CD8(+) T cells and survival of CD8(+) T cells in vitro. Furthermore, RARα is essential for survival of CD8(+) T cells in vivo following Listeria monocytogenes infection. In contrast, RARβ deletion leads to modest deficiency in Ag-specific CD8(+) T cell expansion during infection. The defective survival of RARα-deficient CD8(+) T cells leads to a deficiency in control of L. monocytogenes expansion in the spleen. To our knowledge, these are the first comparative studies of the role of RAR isoforms in CD8(+) T cell immunity.
Figures


Similar articles
-
Tim-3 directly enhances CD8 T cell responses to acute Listeria monocytogenes infection.J Immunol. 2014 Apr 1;192(7):3133-42. doi: 10.4049/jimmunol.1302290. Epub 2014 Feb 24. J Immunol. 2014. PMID: 24567532 Free PMC article.
-
Interleukin (IL)-21-independent pathogen-specific CD8+ T-cell expansion, and IL-21-dependent suppression of CD4+ T-cell IL-17 production.Immunology. 2010 Oct;131(2):183-91. doi: 10.1111/j.1365-2567.2010.03287.x. Immunology. 2010. PMID: 20465570 Free PMC article.
-
Regulator of fatty acid metabolism, acetyl coenzyme a carboxylase 1, controls T cell immunity.J Immunol. 2014 Apr 1;192(7):3190-9. doi: 10.4049/jimmunol.1302985. Epub 2014 Feb 24. J Immunol. 2014. PMID: 24567531 Free PMC article.
-
Listeria monocytogenes: a model pathogen to study antigen-specific memory CD8 T cell responses.Semin Immunopathol. 2015 May;37(3):301-10. doi: 10.1007/s00281-015-0477-5. Epub 2015 Apr 10. Semin Immunopathol. 2015. PMID: 25860798 Free PMC article. Review.
-
Regulation of CD8(+) T cell functions by RARgamma.Semin Immunol. 2009 Feb;21(1):2-7. doi: 10.1016/j.smim.2008.07.002. Epub 2008 Aug 20. Semin Immunol. 2009. PMID: 18715802 Free PMC article. Review.
Cited by
-
Characterization of the microtranscriptome of macrophages infected with virulent, attenuated and saprophyte strains of Leptospira spp.PLoS Negl Trop Dis. 2018 Jul 6;12(7):e0006621. doi: 10.1371/journal.pntd.0006621. eCollection 2018 Jul. PLoS Negl Trop Dis. 2018. PMID: 29979677 Free PMC article.
-
Retinoic Acid, Leaky Gut, and Autoimmune Diseases.Nutrients. 2018 Aug 3;10(8):1016. doi: 10.3390/nu10081016. Nutrients. 2018. PMID: 30081517 Free PMC article. Review.
-
Retinoic acid receptor gamma impacts cellular adhesion, Alpha5Beta1 integrin expression and proliferation in K562 cells.PLoS One. 2017 May 26;12(5):e0178116. doi: 10.1371/journal.pone.0178116. eCollection 2017. PLoS One. 2017. PMID: 28552962 Free PMC article.
-
Tretinoin improves the anti-cancer response to cyclophosphamide, in a model-selective manner.BMC Cancer. 2024 Feb 13;24(1):203. doi: 10.1186/s12885-024-11915-5. BMC Cancer. 2024. PMID: 38350880 Free PMC article.
-
Role of Vitamin A in the Immune System.J Clin Med. 2018 Sep 6;7(9):258. doi: 10.3390/jcm7090258. J Clin Med. 2018. PMID: 30200565 Free PMC article. Review.
References
-
- el Bushra HE, Ash LR, Coulson AH, Neumann CG. Interrelationship between diarrhea and vitamin A deficiency: is vitamin A deficiency a risk factor for diarrhea? Pediatr. Infect. Dis. J. 1992;11:380–384. - PubMed
-
- Iwata M, Hirakiyama A, Eshima Y, Kagechika H, Kato C, Song SY. Retinoic acid imprints gut-homing specificity on T cells. Immunity. 2004;21:527–538. - PubMed
-
- Mora JR, Iwata M, Eksteen B, Song SY, Junt T, Senman B, Otipoby KL, Yokota A, Takeuchi H, Ricciardi-Castagnoli P, et al. Generation of gut-homing IgA-secreting B cells by intestinal dendritic cells. Science. 2006;314:1157–1160. - PubMed
Publication types
MeSH terms
Substances
Grants and funding
LinkOut - more resources
Full Text Sources
Other Literature Sources
Medical
Molecular Biology Databases
Research Materials
