. 2014 Apr 25;289(17):11767-11778.
doi: 10.1074/jbc.M113.524645. Epub 2014 Mar 7.

Decreased cystathionine-γ-lyase (CSE) activity in livers of type 1 diabetic rats and peripheral blood mononuclear cells (PBMC) of type 1 diabetic patients

Affiliations

Decreased cystathionine-γ-lyase (CSE) activity in livers of type 1 diabetic rats and peripheral blood mononuclear cells (PBMC) of type 1 diabetic patients

Prasenjit Manna et al. J Biol Chem. .

Abstract

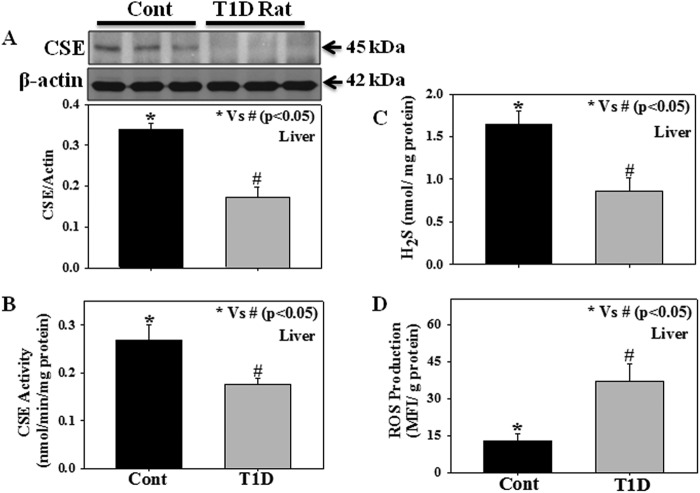
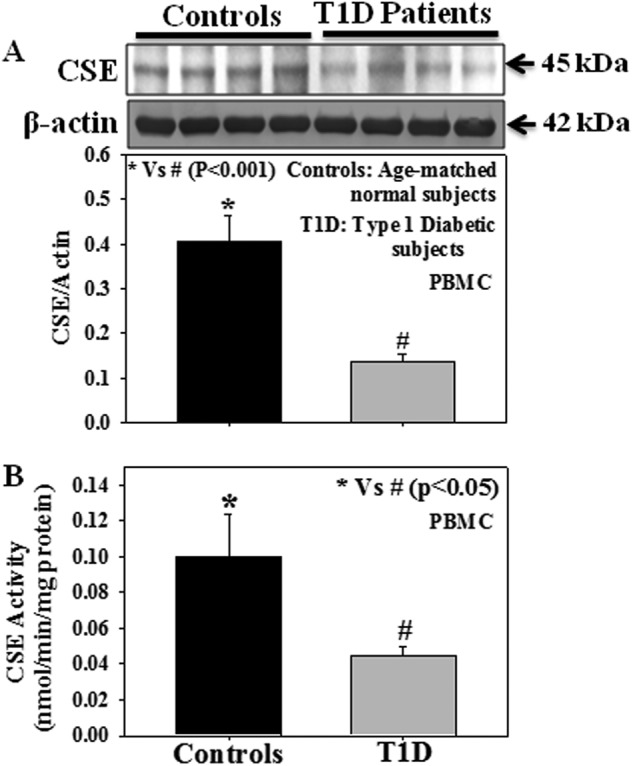
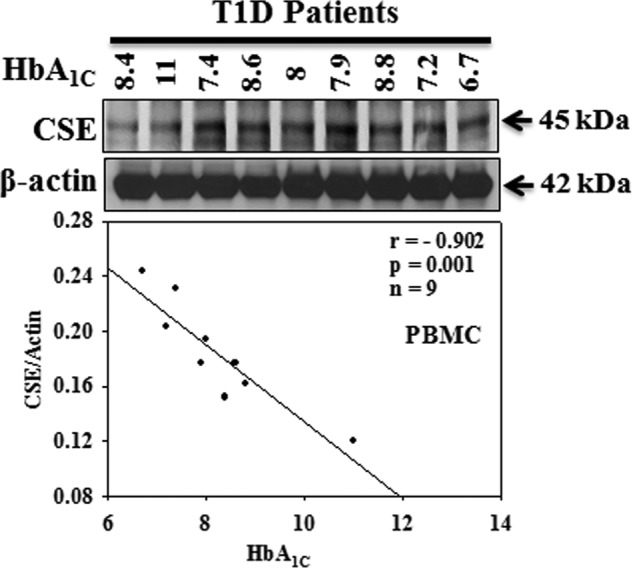
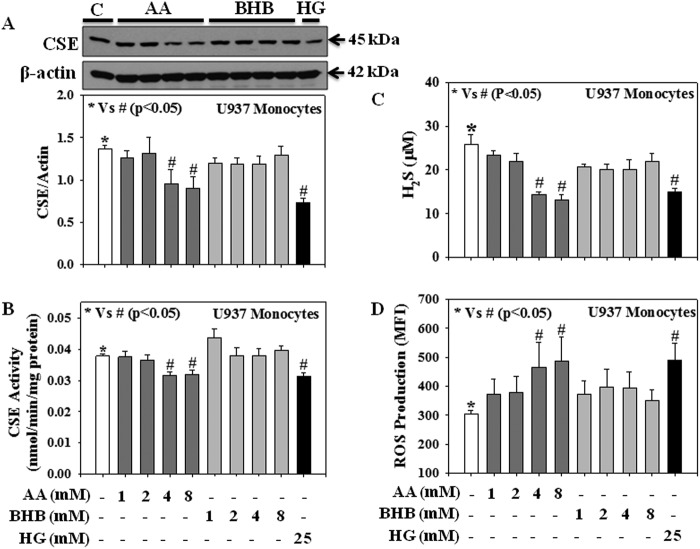
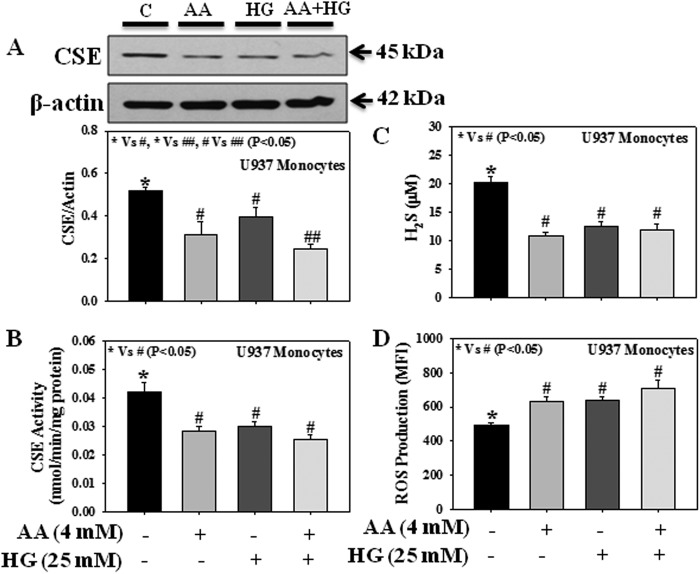
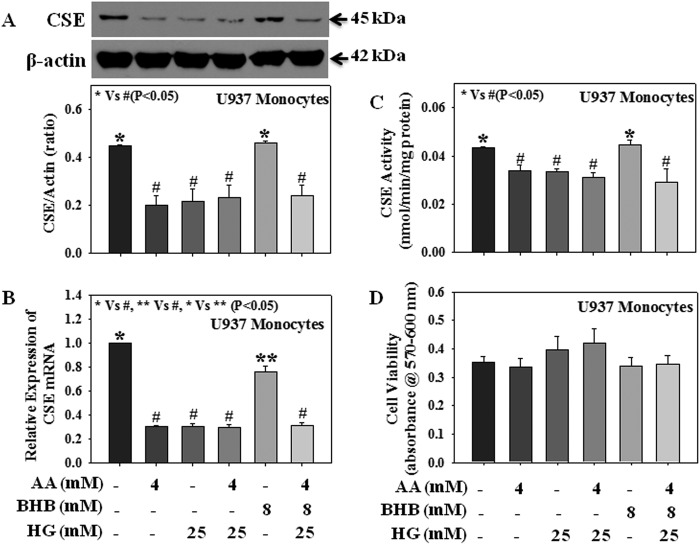
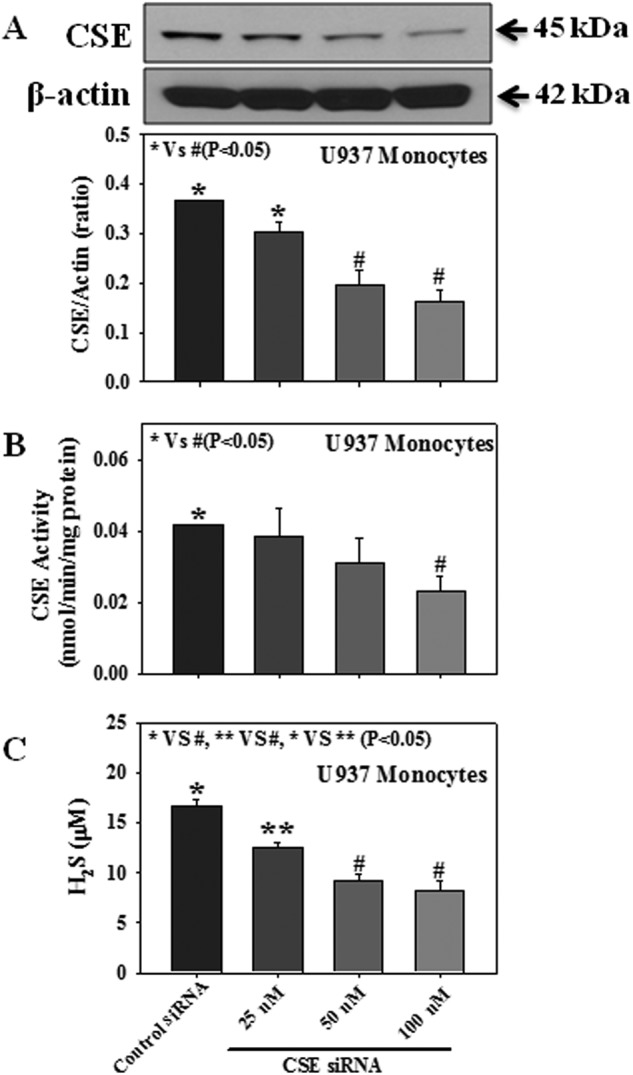
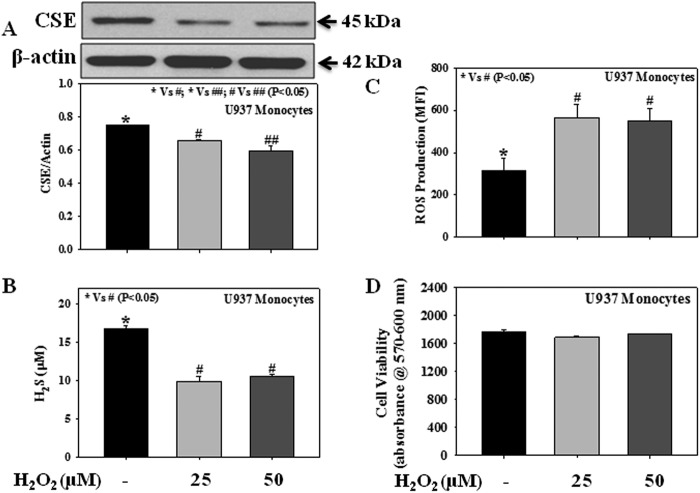
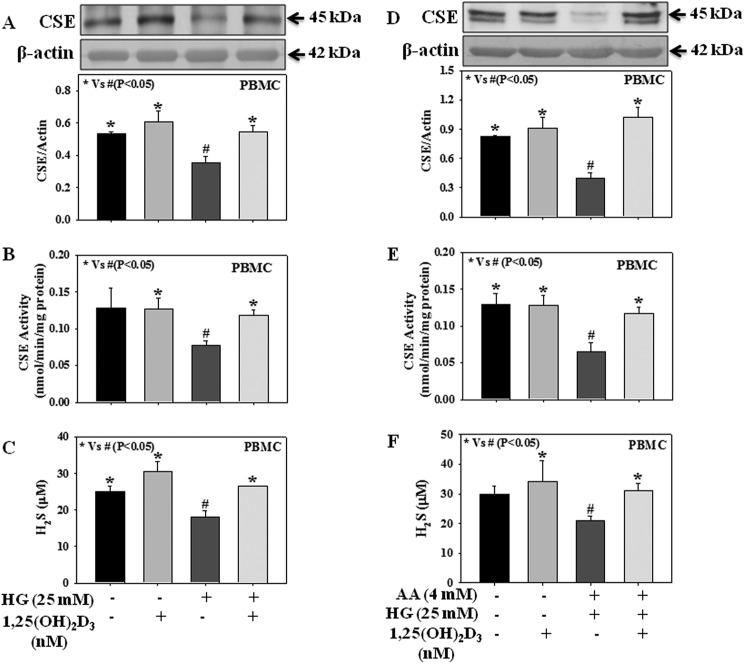
The liver plays a major role in the formation of H2S, a novel signaling molecule. Diabetes is associated with lower blood levels of H2S. This study investigated the activities of cystathionine-γ-lyase (CSE, the enzyme that catalyzes H2S formation) in livers of type 1 diabetic (T1D) animals and in peripheral blood mononuclear cells (PBMC) isolated from T1D patients. T1D is associated with both hyperketonemia (acetoacetate and β-hydroxybutyrate) and hyperglycemia. This study also examined the role of hyperglycemia and hyperketonemia per se in decreased CSE activity using U937 monocytes and PBMC isolated from healthy subjects. Livers from streptozotocin-treated T1D rats demonstrated a significantly higher reactive oxygen species production, lower CSE protein expression and activity, and lower H2S formation compared with those of controls. Studies with T1D patients showed a decrease in CSE protein expression and activity in PBMC compared with those of age-matched normal subjects. Cell culture studies demonstrated that high glucose (25 mm) and/or acetoacetate (4 mm) increased reactive oxygen species, decreased CSE mRNA expression, protein expression, and enzymatic activity, and reduced H2S levels; however, β-hydroxybutyrate treatment had no effect. A similar effect, which was also observed in PBMC treated with high glucose alone or along with acetoacetate, was prevented by vitamin D supplementation. Studies with CSE siRNA provide evidence for a relationship between impaired CSE expression and reduced H2S levels. This study demonstrates for the first time that both hyperglycemia and hyperketonemia mediate a reduction in CSE expression and activity, which can contribute to the impaired H2S signaling associated with diabetes.

Keywords: Acetoacetate; Diabetes; Glucose; Hydrogen Sulfide; Ketone Bodies.


Figures

FIGURE 1.
FIGURE 1.
Enzymatic activity and protein expression of CSE, the levels of H2S formation, and ROS production in the liver tissue of experimental rats; control (Cont), 14-week-old Sprague-Dawley rats), T1D (STZ-treated 14-week-old Sprague-Dawley rats). A, CSE expression; B, CSE activity; C, tissue H2S levels; D, ROS production. Values are expressed as the mean ± S.E. (n = 6). Blots represent data from three rats in each group.
FIGURE 2.
FIGURE 2.
Effect of T1D on the CSE protein expression and its activity in PBMC isolated from T1D patients and age-matched normal subjects. A, CSE expression (controls, n = 18; T1D patients, n = 17). B, CSE activity (controls, n = 10; T1D patients, n = 10). Due to the limited sample size, n values differ between CSE expression and CSE activity studies. Values are expressed as the mean ± S.E.
FIGURE 3.
FIGURE 3.
Correlation of CSE protein expression with HbA1C in PBMC isolated from T1D patients. Due to the inconsistent exposure from one blot to another, we included the data from only one blot for the calculation of CSE expression and its relation to HbA1C levels in T1D patients (n value mentioned in the figure).
FIGURE 4.
FIGURE 4.
Effect of AA, BHB, and HG on both CSE protein expression and its activity, H2S levels, and the intracellular ROS production in U937 monocytic cells. A, CSE expression. B, CSE activity; C, H2S levels; D, ROS production. Cells were treated with AA (1, 2, 4, or 8 mm) or BHB (1, 2, 4, or 8 mm) or HG (25 mm) for 20 h. Values are expressed as the mean ± S.E. (n = 3).
FIGURE 5.
FIGURE 5.
Effect of AA and HG either alone or in combination on the protein expression and enzyme activity of CSE, H2S levels, and the intracellular ROS production in U937 monocytic cells. A, CSE expression. B, CSE activity. C, H2S levels. D, ROS production. Cells were treated with AA (4 mm) or HG (25 mm) either alone or in combination for 20 h. Values are expressed as the mean ± S.E. (n = 3).
FIGURE 6.
FIGURE 6.
Effect of AA, BHB, and HG either alone or in combination on the mRNA expression, protein expression, and enzyme activity of CSE in U937 monocytic cells. A, CSE protein expression. B, CSE mRNA expression; C, CSE activity. D, cell viability. Cells were treated with AA (4 mm), BHB (8 mm), or HG (25 mm) either alone or in combination for 20 h. Values are expressed as the mean ± S.E. (n = 3).
FIGURE 7.
FIGURE 7.
Effect of CSE protein expression, CSE activity, and H2S levels in either CSE siRNA-transfected or control siRNA-transfected U937 monocytes. A, CSE protein expression. B, CSE activity. C, H2S formation. Cells were transfected with either CSE siRNA (25, 50, or 100 nm) or control siRNA, a scrambled nonspecific RNA duplex with no sequence homology with any of the genes. Values are the mean ± S.E. (n = 3).
FIGURE 8.
FIGURE 8.
Effect of the exogenous oxidant H2O2 on the protein expression of CSE, levels of H2S, and the intracellular ROS production in U937 monocytic cells. A, CSE expression. B, H2S levels. C, ROS production. D, cell viability. Cells were treated with H2O2 (25 or 50 μm) for 3 h. Values are expressed as the mean ± S.E. (n = 3).
FIGURE 9.
FIGURE 9.
Effect of 1,25-dihydroxyvitamin D3 (1,25(OH)2D3) on the CSE protein expression and its activity and H2S levels in PBMC (isolated from normal healthy volunteers) treated with AA and HG either alone or in combination. A and D, CSE expression. B and E, CSE activity. C and F, H2S levels. Cells were treated with 1,25-dihydroxyvitamin D3 (25 nm, 2 h) followed by incubation with HG (25 mm) alone or in combination with AA (4 mm) for next 16 h. Values are expressed as the mean ± S.E. (n = 4).

References

    1. Elsey D. J., Fowkes R. C., Baxter G. F. (2010) Regulation of cardiovascular cell function by hydrogen sulfide (H2S). Cell Biochem. Funct. 28, 95–106 - PubMed
    1. Liu Y. H., Lu M., Hu L. F., Wong P. T., Webb G. D., Bian J. S. (2012) Hydrogen sulfide in the mammalian cardiovascular system. Antioxid. Redox Signal.. 17, 141–185 - PubMed
    1. Manna P., Jain S. K. (2013) l-Cysteine and hydrogen sulfide increase PIP3 and AMPK/PPARγ expression and decrease ROS and vascular inflammation markers in high glucose-treated human U937 monocytes. J. Cell Biochem. 114, 2334–2345 - PubMed
    1. Pan L. L., Liu X. H., Gong Q. H., Wu D., Zhu Y. Z. (2011) Hydrogen sulfide attenuated tumor necrosis factor-α-induced inflammatory signaling and dysfunction in vascular endothelial cells. PLoS ONE 6, e19766. - PMC - PubMed
    1. Manna P., Jain S. K. (2011) Hydrogen sulfide and l-cysteine increase phosphatidylinositol 3,4,5-trisphosphate (PIP3) and glucose utilization by inhibiting phosphatase and tensin homolog (PTEN) protein and activating phosphoinositide 3-kinase (PI3K)/serine/threonine protein kinase (AKT)/protein kinase Cζ/λ (PKCζ/λ) in 3T3l1 adipocytes. J. Biol. Chem. 286, 39848–39859 - PMC - PubMed

Publication types

Substances