. 2014 May;197(1):317-36.
doi: 10.1534/genetics.114.163477. Epub 2014 Mar 7.

The effect of linkage on establishment and survival of locally beneficial mutations

Affiliations

The effect of linkage on establishment and survival of locally beneficial mutations

Simon Aeschbacher et al. Genetics. 2014 May.

Abstract

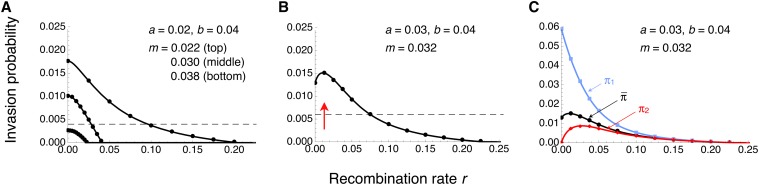
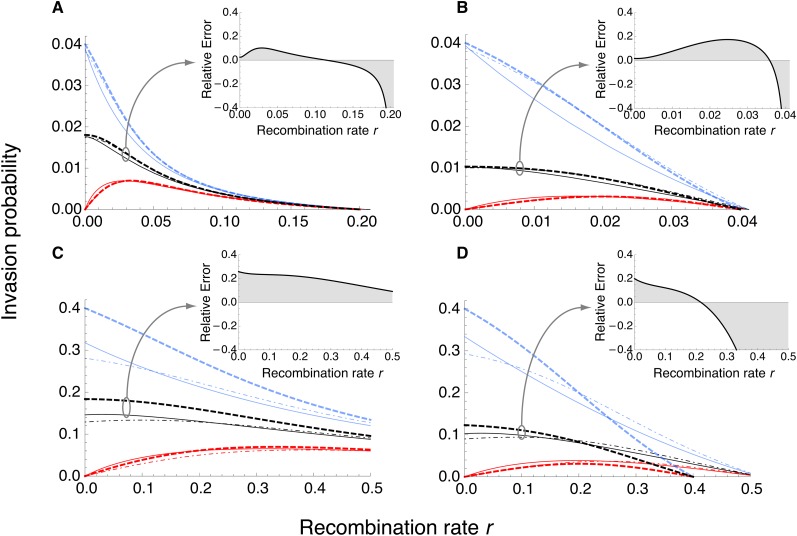
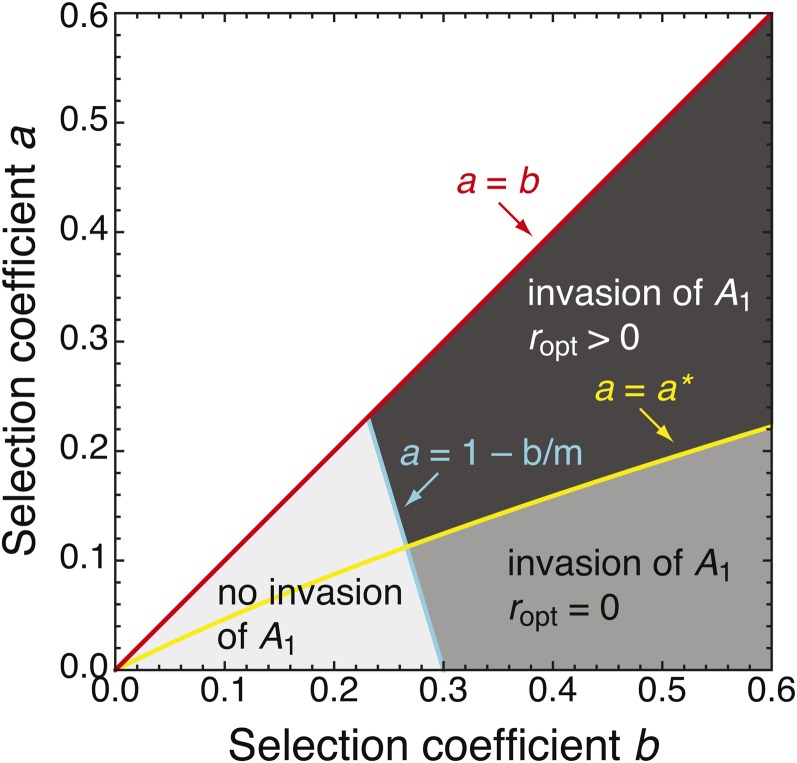
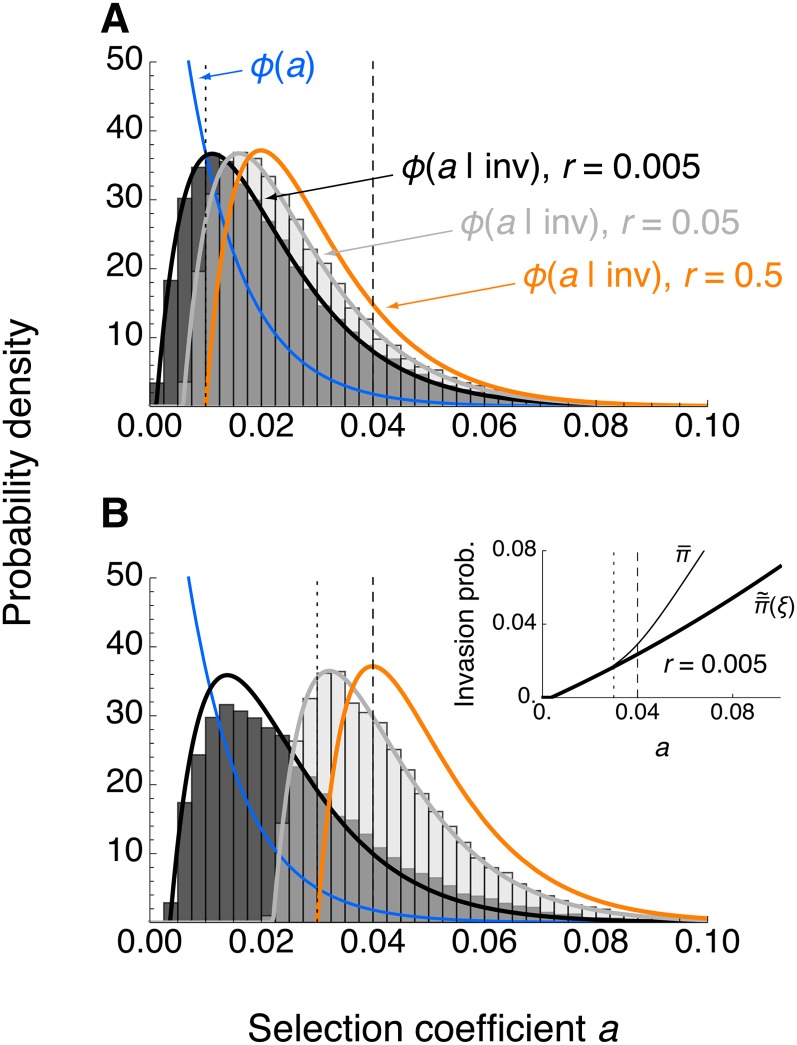
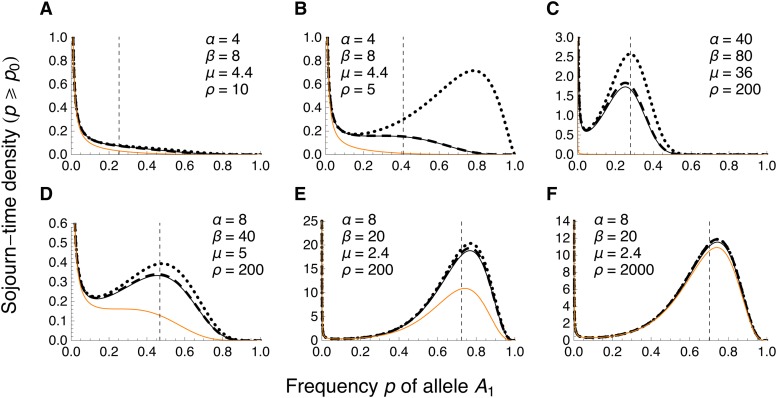
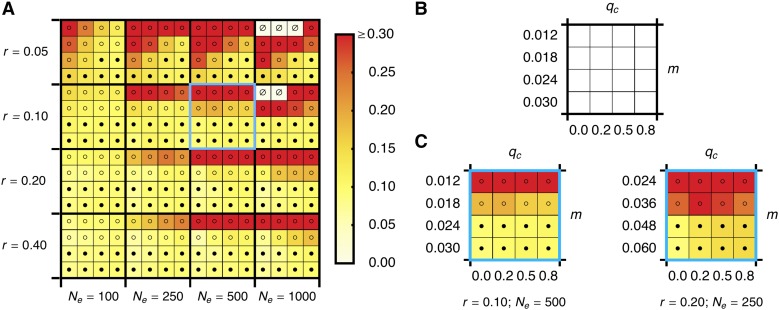
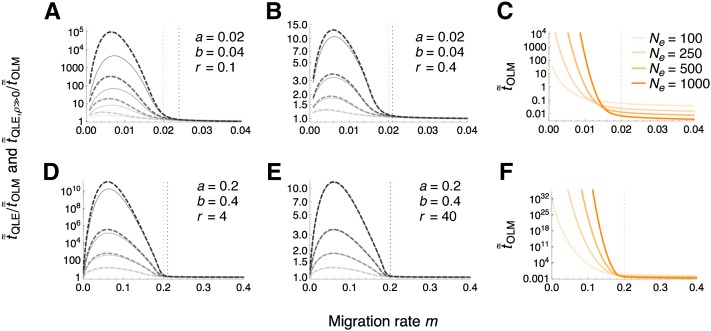
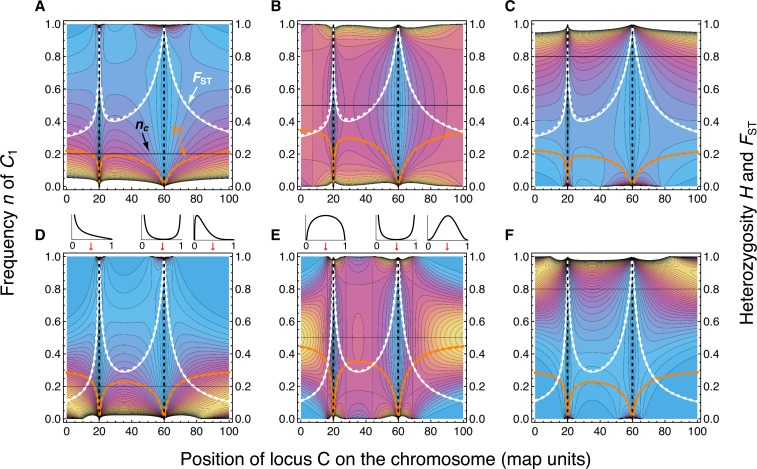
We study invasion and survival of weakly beneficial mutations arising in linkage to an established migration-selection polymorphism. Our focus is on a continent-island model of migration, with selection at two biallelic loci for adaptation to the island environment. Combining branching and diffusion processes, we provide the theoretical basis for understanding the evolution of islands of divergence, the genetic architecture of locally adaptive traits, and the importance of so-called "divergence hitchhiking" relative to other mechanisms, such as "genomic hitchhiking", chromosomal inversions, or translocations. We derive approximations to the invasion probability and the extinction time of a de novo mutation. Interestingly, the invasion probability is maximized at a nonzero recombination rate if the focal mutation is sufficiently beneficial. If a proportion of migrants carries a beneficial background allele, the mutation is less likely to become established. Linked selection may increase the survival time by several orders of magnitude. By altering the timescale of stochastic loss, it can therefore affect the dynamics at the focal site to an extent that is of evolutionary importance, especially in small populations. We derive an effective migration rate experienced by the weakly beneficial mutation, which accounts for the reduction in gene flow imposed by linked selection. Using the concept of the effective migration rate, we also quantify the long-term effects on neutral variation embedded in a genome with arbitrarily many sites under selection. Patterns of neutral diversity change qualitatively and quantitatively as the position of the neutral locus is moved along the chromosome. This will be useful for population-genomic inference. Our results strengthen the emerging view that physically linked selection is biologically relevant if linkage is tight or if selection at the background locus is strong.

Keywords: adaptive divergence; establishment; gene flow; linked selection; local adaptation.


Figures

Figure 1
Figure 1
Invasion probability of A1 as a function of the recombination rate for a monomorphic continent. (A and B) Weighted average invasion probabilitiy π¯ across the two genetic backgrounds B1 and B2 (Equations 2 and 4). For comparison, horizontal dashed lines give 10% of Haldane’s (1927) approximation 2a, valid for m = 0 and r = 0.5. (B) The optimal recombination rate ropt, defined as the recombination rate at which π¯ is maximized (red arrow), is nonzero. (C) Same as in B, but in addition to the weighted average, the invasion probabilities of A1 conditional on initial occurrence on the B1 or B2 background are shown in blue or red, respectively. Note the difference in the scale of the vertical axis between B and C. In A–C, curves show exact numerical solutions to the branching process. Dots represent the point estimates across 106 simulations under the branching-process assumptions (see Methods). Error bars span twice the standard error on each side of the point estimates, but are too short to be visible.
Figure 2
Figure 2
Approximation to the invasion probability of A1 for a monomorphic continent. Invasion probabilities are shown for A1 initially occurring on the beneficial background B1 (blue), on the deleterious background B2 (red), and as a weighted average across backgrounds (black). Analytical approximations assuming a slightly supercritical branching process (dot-dashed curves) and, in addition, weak evolutionary forces (Equation 12; thick dashed curves) are compared to the exact numerical branching-process solution (solid curves). Inset figures show the error of the analytical approximation π˜¯(ζ) (thick dashed black curve) relative to π¯ (solid black curve), π˜¯(ζ)/π¯1. (A) a = 0.02, b = 0.04, m = 0.022. (B) a = 0.02, b = 0.04, m = 0.03. (C) a = 0.2, b = 0.4, m = 0.22. (D) a = 0.2, b = 0.4, m = 0.3. As expected, the analytical approximations are very good for weak evolutionary forces (top row), but less so for strong forces (bottom row).
Figure 3
Figure 3
Optimal recombination rate and regions of invasion. The dark shaded area indicates where the optimal recombination rate r is positive (ropt > 0; cf. Figure 1B). The medium shaded area shows the parameter range for which ropt = 0 (cf. Figure 1A). Together, these two areas indicate where A1 can invade via the marginal one-locus migration–selection equilibrium EB if r is sufficiently small. The light shaded area shows where EB does not exist and A1 cannot invade via EB. The area above a = b is not of interest, as we focus on mutations that are weakly beneficial compared to selection at the background locus (a < b). The critical selection coefficient a is given in Equation 14 and the migration rate is m = 0.3 (other values of m yield qualitatively similar diagrams). The continent is monomorphic (qc = 0).
Figure 4
Figure 4
DFE of successfully invading mutations for a monomorphic continent. The DFE of successfully invading mutations was obtained as φ(a|inv)=φ(inv|a)φ(a)/0φ(inv|a)φ(a)da, where φ(inv|a)=π˜¯(ξ)=q^Bπ˜1(ξ)+(1q^B)π˜2(ξ), with q^B and π˜i(ξ) as in Equations 2 and 12, respectively. The mutational input distribution was assumed to be exponential, φ(a) = λe (blue). Vertical lines denote a = m (dotted) and a = b (dashed). Histograms were obtained from simulations under the branching-process assumptions (intermediate shading indicates where histograms overlap). Each represents 2.5 × 10⁴ realizations in which A1 successfully invaded (see Methods). As a reference, the one-locus model (no linkage) is shown in orange. (A) Relatively weak migration: b = 0.04, m = 0.01. (B) Migration three times stronger: b = 0.04, m = 0.03. In A and B, λ = 100 and φ(a|inv) is shown for a recombination rate of r = 0.005 (black) and r = 0.05 (gray). The inset in B shows why the fit is worse for r = 0.005: in this case, π˜¯(ξ) underestimates the exact invasion probability π¯ (Equation 4) for large a.
Figure 5
Figure 5
Diffusion approximation to the sojourn-time density of A1 under quasi-linkage equilibrium for a monomorphic continent. Comparison of the STD t2,QLE(p; p0) (thin black; Equation 7b) to the approximation valid for small p0, t˜2,QLE(p;p0) (dashed black; Equation 109 in File S1), and the one based on the additional assumption of ρ ≫ max(α, β, μ), t˜2,QLE,ρ0(p;p0) (dotted; Equation 17b). The STD for the one-locus model, t˜2,OLM(p;p0), is shown in orange as a reference. Vertical lines give the deterministic frequency p^+ of A1 at the fully polymorphic equilibrium (computed in File S7). (A) Weak evolutionary forces relative to genetic drift. (B) As in A, but with half the scaled recombination rate ρ. The assumption of ρ ≫ max(α, β, μ) is violated and hence t˜2,QLE,ρ0(p;p0) is a poor approximation of t2,QLE(p; p0). (C) Strong evolutionary forces relative to genetic drift. The STD has a pronounced mode different from p = 0, but t˜2,QLE,ρ0(p;p0) overestimates t2,QLE(p; p0) considerably. (D) Strong assymmetry in selection coefficients and moderate migration. As in C, the STD has a pronounced mode different from p = 0, but t˜2,QLE,ρ0(p;p0) now approximates t2,QLE(p; p0) better. (E) Recombination 10 times stronger than selection at locus B. (F) As in E, but with recombination 100 times stronger than selection at locus B. In A–F, p0 = 0.005, which corresponds to an island population of size N = 100 and a single initial copy of A1.
Figure 6
Figure 6
Relative error of the diffusion approximation to the mean absorption time of A1. (A) The error of t¯QLE from Equation 8 relative to simulations for various parameter combinations. Squares bounded by thick lines delimit combinations of values of the recombination rate r and the effective population size Ne. Within each of them, values of the migration rate m and the continental frequency qc of B1 are as shown in B. No negative relative errors were observed. For better resolution, we truncated values >0.30 (the maximum was 3.396 for Ne = 1000, r = 0.05, m = 0.018, qc = 0.0). Open (solid) circles indicate that the marginal one-locus equilibrium E˜B is unstable (stable) and A1 can (not) be established under deterministic dynamics. Parameter combinations for which simulations were too time consuming are indicated by ∅. Selection coefficients are a = 0.02 and b = 0.04. (C) The left plot corresponds to the square in A that is framed in blue. The right plot shows the fit of the diffusion approximation to simulations conducted with unscaled parameters twice as large and Ne half as large, as on the left side. Scaled parameters are equal on both sides. As expected, the diffusion approximation is worse on the right side. Simulations were as described in Methods. See Table S1 for numerical values.
Figure 7
Figure 7
Mean absorption time of A1 under quasi-linkage equilibrium relative to the one-locus model (OLM). In panels (A), (B), (D) and (E), thin solid curves show the ratio t¯˜QLE/t¯˜OLM and thick dashed curves t¯˜QLE,ρ0/t¯˜OLM, as a function of the migration rate m. The effective population size Ne increases from light to dark gray, taking values of 100, 250, 500, and 1000. Vertical lines denote the migration rate below which A1 can invade in the deterministic one-locus (orange) and two-locus (black) model. (A) Recombination is too weak for the assumption ρ ≫ max(α, β, μ) to hold. (B) As in (A), but with recombination four times stronger. (D) Evolutionary forces – other than drift – are ten times stronger than in (B). (E) As in (D), but with recombination ten times stronger. Panels (C) and (F) show the mean absorption time (in multiples of 2Ne) under the one-locus model for the respective row. For m close to 0, numerical procedures are unstable and we truncated the curves. As m converges to 0, t¯˜QLE/t¯˜OLM and t¯˜QLE,ρ0/t¯˜OLM are expected to approach unity, however.
Figure 8
Figure 8
The effect of linked selection on neutral diversity and population divergence. Shown are top views of the stationary allele frequency distribution on the island for a neutral biallelic locus C linked to two selected sites at (locus A) 20 and (locus B) 60 map units from the left end of the chromosome. Density increases from light blue to yellow (high peaks were truncated for better resolution). Orange and white curves show the expected diversity (heterozygosity H) and population divergence (FST) as a function of the position of the neutral site. Solid curves use exact, numerically computed values of the effective migration rate and dashed curves use the approximations given in Equation 23. One map unit (cM) corresponds to r = 0.01 and the effective size of the island population is Ne = 100. The continental frequency nc of allele C1 is indicated by a horizontal black line and, from left to right, equal to 0.2, 0.5 and 0.8. (A–C) Relatively strong drift and weak migration compared to selection: α = 4, β = 80, μ = 2. (D–F) Relatively weak drift and migration on the same order of magnitude as selection at locus A: α = 40, β = 800, μ = 48. Note that H is sensitive to nc, whereas FST is not. On top of D and E, allele frequency distributions that result from taking vertical slices at positions indicated by red arrows are shown (15, 59 and 90 cM).

References

    1. Akerman A., Bürger R., 2014. The consequences of gene flow for local adaptation and differentiation: a two-locus two-deme model. J. Math. Biol. 68: 1135–1198. - PMC - PubMed
    1. Bank C., Bürger R., Hermisson J., 2012. The limits to parapatric speciation: Dobzhansky–Muller incompatibilities in a continent–island model. Genetics 191: 845–863. - PMC - PubMed
    1. Barrett R. D. H., M’Gonigle L. K., Otto S. P., 2006. The distribution of beneficial mutant effects under strong selection. Genetics 174: 2071–2079. - PMC - PubMed
    1. Barton N., 1979. Gene flow past a cline. Heredity 43: 333–339.
    1. Barton N., Bengtsson B. O., 1986. The barrier to genetic exchange between hybridising populations. Heredity 57: 357–376. - PubMed

Publication types

LinkOut - more resources