. 2014 Mar 13;156(6):1312-1323.
doi: 10.1016/j.cell.2014.02.022. Epub 2014 Mar 6.

The transcription factor titration effect dictates level of gene expression

Affiliations

The transcription factor titration effect dictates level of gene expression

Robert C Brewster et al. Cell. .

Abstract

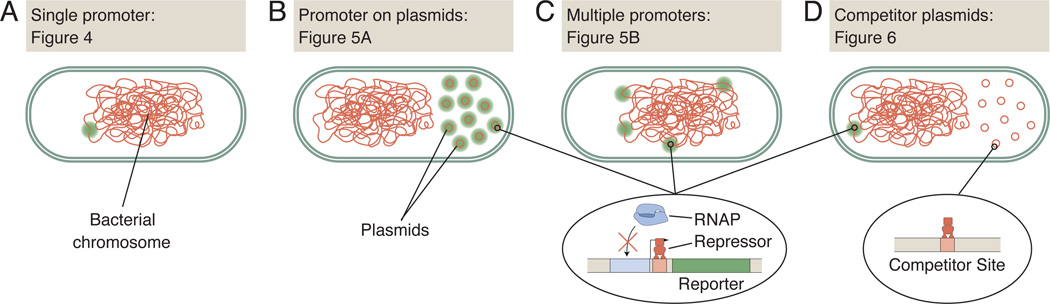
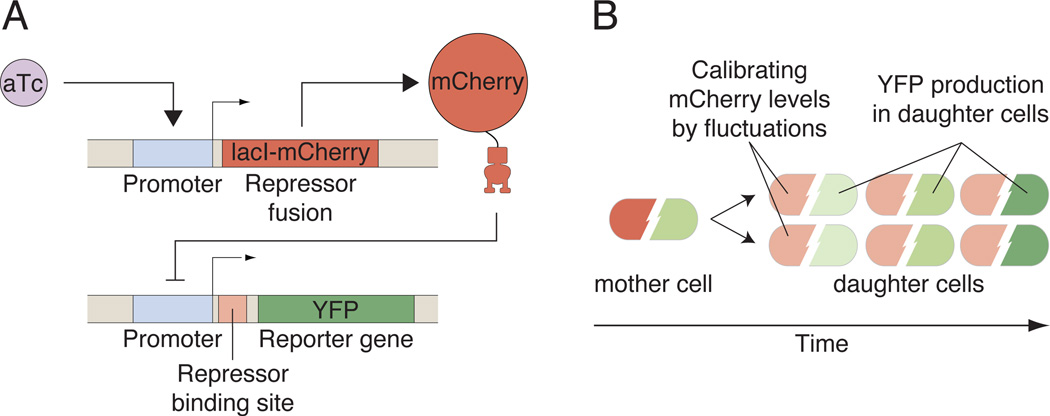
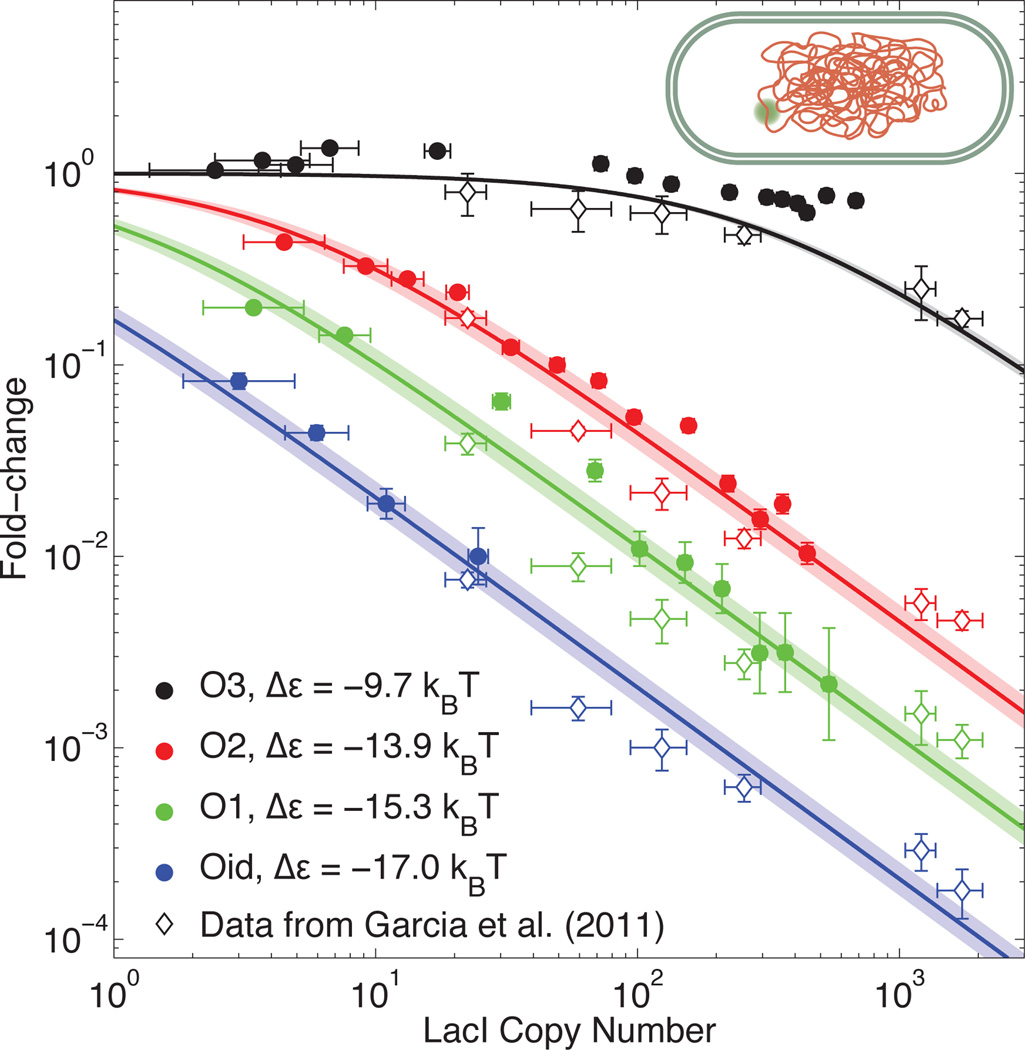
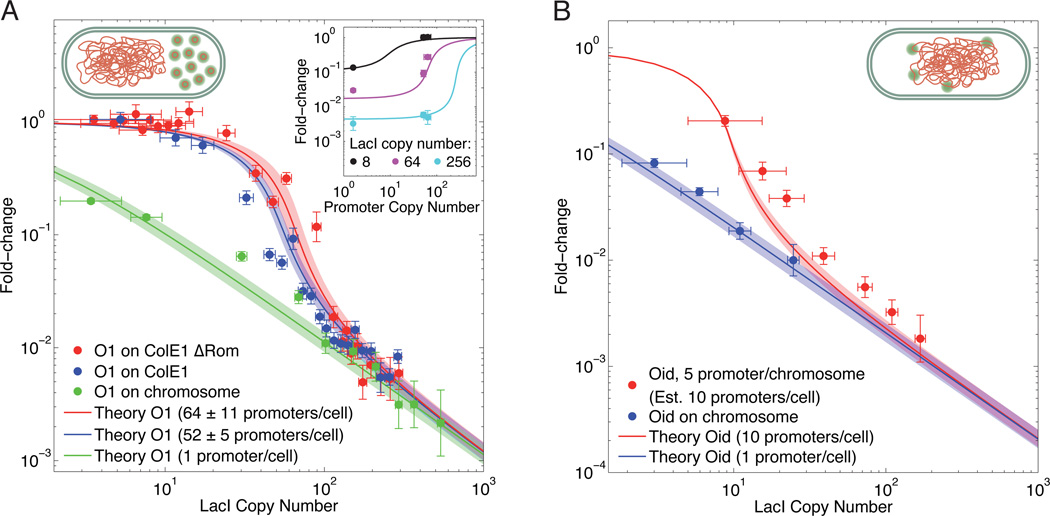
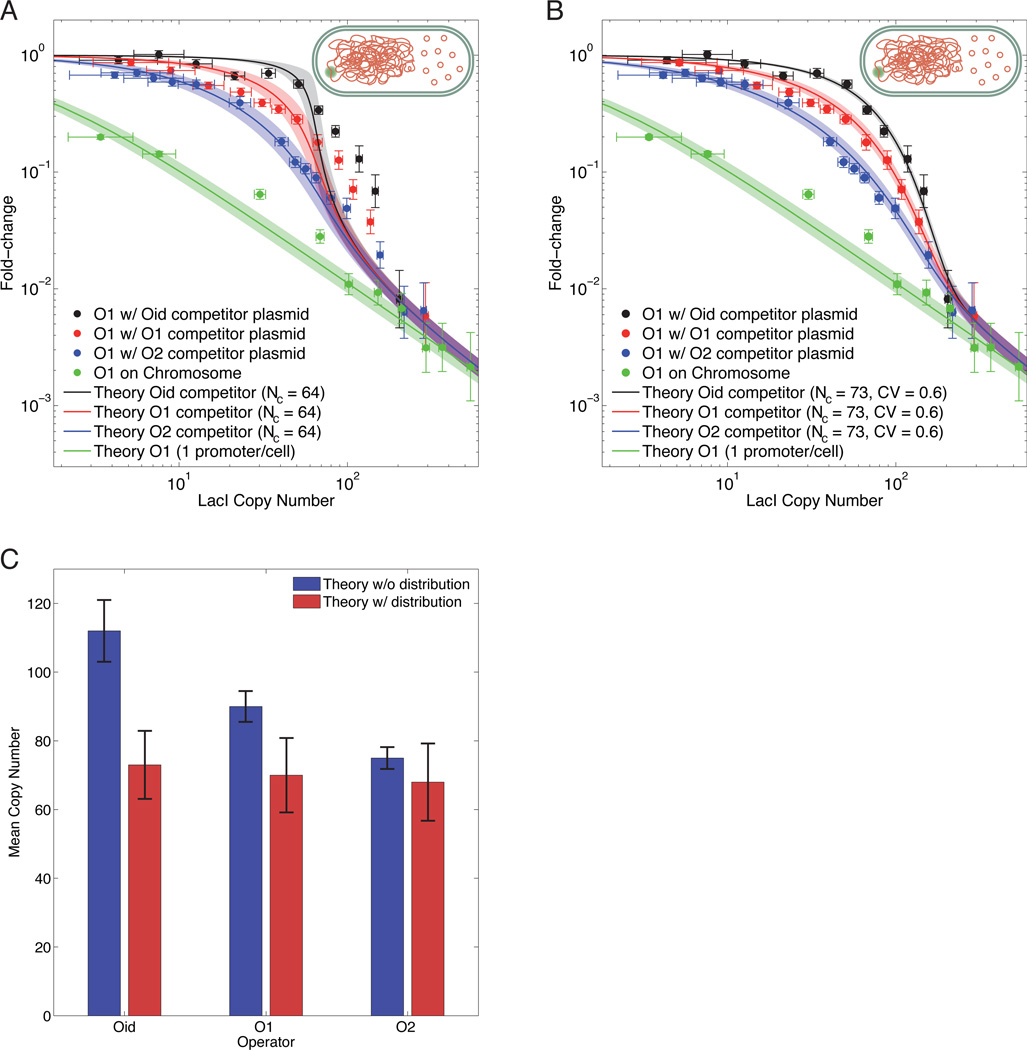
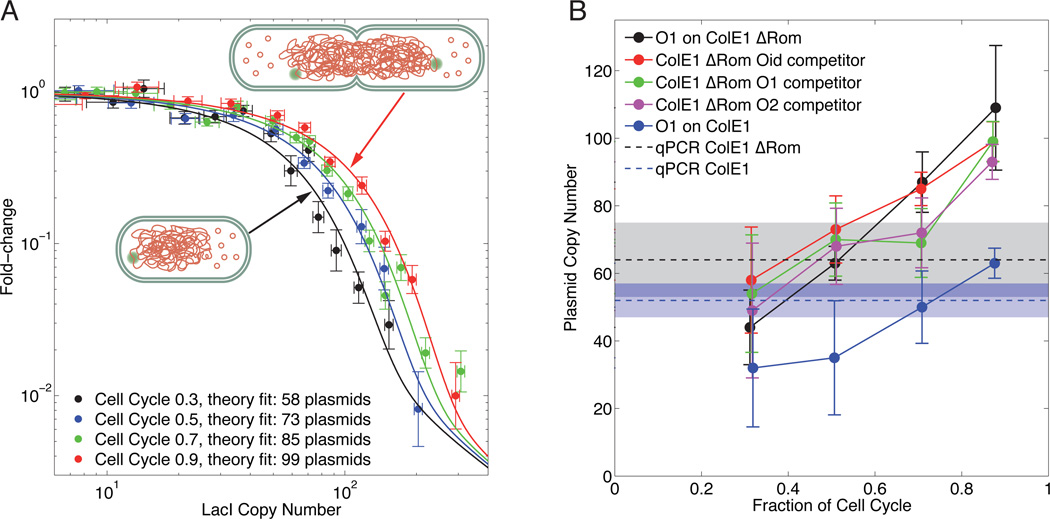
Models of transcription are often built around a picture of RNA polymerase and transcription factors (TFs) acting on a single copy of a promoter. However, most TFs are shared between multiple genes with varying binding affinities. Beyond that, genes often exist at high copy number-in multiple identical copies on the chromosome or on plasmids or viral vectors with copy numbers in the hundreds. Using a thermodynamic model, we characterize the interplay between TF copy number and the demand for that TF. We demonstrate the parameter-free predictive power of this model as a function of the copy number of the TF and the number and affinities of the available specific binding sites; such predictive control is important for the understanding of transcription and the desire to quantitatively design the output of genetic circuits. Finally, we use these experiments to dynamically measure plasmid copy number through the cell cycle.


Figures

Figure 1
Figure 1. Examples examined in this study of transcriptional regulation with competition for the TF
(A) Single chromosomal copy of the gene of interest. (B,C) Competition from multiple, identical genes in the simple repression regulatory architecture when the promoters are (B) placed on a high copy number plasmid or (C) integrated in multiple chromosomal locations. (D) The chromosomal reporter construct competes with competitor plasmids which have binding sites for the repressor, but do not code for the reporter gene. In this particular case the competitor binding sites can have a different affinity than the regulated gene.
Figure 2
Figure 2. Experimental methods for the single-cell dissection of regulatory architectures
(A) Genetic circuit employed in this work. The expression of the LacI-mCherry fusion is induced by the small molecule aTc. The repressor acts on a promoter expressing a YFP reporter gene. (B) Individual cells are observed through a division event. The fluctuations in the partitioning of the LacI-mCherry between the daughters is used to calibrate the signal such that the mCherry fluorescence measurement in each cell can be expressed as an absolute number of repressor molecules. In addition, the rate of YFP production is measured over the cell cycle.
Figure 3
Figure 3. Simple repression of a single chromosomal construct
Fold-change of simple repression construct located on the chromosome as a function of Lac repressor copy number. The solid lines correspond to equation 3 with values for Δε from steady-state measurements of expression. The data from steady-state measurements (Garcia and Phillips, 2011) is shown as open symbols. The data from our experiments (filled symbols) is both consistent with the model with no free parameters (curves) and with expression data obtained from the same construct in steady-state measurements. The shaded regions on the curves represent the uncertainty from the errors in the measurement of the binding energies. For the solid points, error bars in fold-change measurements are standard errors of the mean and error bars in LacI copy number are the quadrature summed errors from the calibration factor and the inherent resolution limit of LacI detection.
Figure 4
Figure 4. Fold-change of multiple identical gene copies
(A) Fold-change as a function of Lac repressor copy number for two distinct plasmids with the O1 simple repression motif on a high copy number (ColE1) plasmid with (blue) and without (red) the Rom protein. Measurements are performed at the middle of the cell cycle. The blue and red solid lines are the theory from equation 4 using the average copy number measured by qPCR and known binding energies from earlier steady-state measurements as in Figure 3. The shaded regions represent the combined uncertainty in the copy number measurement and the binding energy measurement. For reference, the green symbols and line are the data and theory prediction from Figure 3 for simple repression with the O1 binding site for a single chromosomal copy. The inset shows the predicted scaling (lines) and measured fold-change (points) for three distinct repressor copy numbers as the number of promoter copies is varied. (B) Fold-change as a function of concentration of Lac repressor for multiple gene copies on the chromosome. The red symbols are measurements of the fold-change in expression at the end of the cell cycle of a strain with the Oid simple repression motif integrated into 5 unique sites on the chromosome. We expect 10 copies of the gene at the end of the cell cycle. The red line is the theory prediction for multiple identical gene copies with N = 10 from equation 4. The shaded region represents the uncertainty from the measured value of Δε. The blue symbols and line are the data and theory prediction for simple repression with the Oid binding site from Figure 3. In both cases, the fold-change is approximately 1 when the copy number of the repressor is less than the copy number of the gene. At high repressor copy number, the curve coincides with simple repression from the chromosome with a sharp transition between these two regimes. Error bars in fold-change measurements are standard errors of the mean. Error bars in LacI copy number are the quadrature summed errors from the calibration factor and the inherent resolution limit of LacI detection. Error bars in promoter copy number reflect uncertainty in the qPCR measurement of average plasmid copy number.
Figure 5
Figure 5. Effects of repressor competition on expression
(A) Fold-change as a function of concentration of Lac repressor for the O1 simple repression construct integrated into the chromosome in competition with a ColE1 ΔRom plasmid containing a stronger (Oid; black symbols), equal (O1; red symbols) or weaker (O2; blue symbols) Lac repressor binding site. For reference, the green symbols and line are the data and theory prediction, from Figure 3, for simple repression with the O1 binding site without the competitor plasmid. (B) The same data from (A) but now the solid lines represent the plasmid distribution theory assuming a normal distribution. The parameters are found by fitting the Oid (black) data for N, the average copy number, and the CV and these parameters are plotted for each binding energy, i.e. the red and blue curve are parameter free. Error bars in fold-change measurements are standard errors of the mean. Error bars in LacI copy number are the quadrature summed errors from the calibration factor and the inherent resolution limit of LacI detection. (C) Fitted means of all three plasmid copy numbers for both the theory in equation 5 which assumes a single static copy number for plasmid (blue bars, NcOid=112,NcO1=90,NcO2=75), and the same theory where the plasmid distribution is normal with CV as determined from fitting the Oid data (red bars, NcOid=73,NcO1=70,NcO2=68). All three plasmids in this case have the same origin of replication and differ only by a few bases which alter Lac repressor affinity to their binding sites. As such we expect all three plasmids to have identical copy numbers. This is observed for the theory with plasmid distribution (red bars) however the theory without a plasmid distribution systematically overestimates the copy number for stronger binding (blue bars). Error bars in Mean copy number are the results of bootstrap sampling the expression measurements of individual cells.
Figure 6
Figure 6. Variation of plasmid copy number throughout the cell cycle
(A) Fold-change as a function of LacI copy number for the O1 simple repression construct integrated into the chromosome in the presence of a competing ColE1 ΔRom plasmid bearing an Oid site for different time points in the cell cycle. The “cell cycle” parameter is the average fraction of the total cell lifetime from which the binned data is taken with 0 representing birth and 1 representing the cell division. The plasmid copy number is fit to equation 9 at every time point, keeping CV = 0.6 fixed, and the resulting value for N is listed in the legend. Error bars in fold-change measurements are standard errors of the mean. Error bars in LacI copy number are the quadrature summed errors from the calibration factor and the inherent resolution limit of LacI detection. (B) Plasmid copy number versus the cell cycle. The plasmid copy number is measured by fitting the copy number parameter in the theory to the data from all our experiments binned by time in the cell cycle. Error bars in Plasmid copy number are the results of bootstrap sampling the expression measurements of individual cells. The horizontal dashed lines and matching shaded regions are our qPCR measurements for average copy number of ColE1 (blue dashed line) and ColE1 ΔRom (black dashed line).

Comment in

References

    1. Aitman TJ, Dong R, Vyse TJ, Norsworthy PJ, Johnson MD, Smith J, Mangion J, Roberton-Lowe C, Marshall AJ, Petretto, et al. Copy number polymorphism in Fcgr3 predisposes to glomerulonephritis in rats and humans. Nature. 2006;439:851–855. - PubMed
    1. Babu MM, Teichmann SA. Functional determinants of transcription factors in Escherichia coli: protein families and binding sites. Trends Genet. 2003;19:75–79. - PubMed
    1. Bhattacharyya RP, Remenyi A, Yeh BJ, Lim WA. Domains, Motifs, and Scaffolds: The Role of Modular Interactions in the Evolution and Wiring of Cell Signaling Circuits. Annu Rev Biochem. 2006;75:655–680. - PubMed
    1. Bintu L, Buchler NE, Garcia HG, Gerland U, Hwa T, Kondev J, Kuhlman T, Phillips R. Transcriptional regulation by the numbers: applications. CurrOpin Genet Dev. 2005a;15:125–135. - PMC - PubMed
    1. Bintu L, Buchler NE, Garcia HG, Gerland U, Hwa T, Kondev J, Phillips R. Transcriptional regulation by the numbers: models. CurrOpin Genet Dev. 2005b;15:116–124. - PMC - PubMed

Publication types

Substances

LinkOut - more resources