. 2014 Mar 11;16(2):R65.
doi: 10.1186/ar4503.

Angiotensin receptor type 1 and endothelin receptor type A on immune cells mediate migration and the expression of IL-8 and CCL18 when stimulated by autoantibodies from systemic sclerosis patients

Angiotensin receptor type 1 and endothelin receptor type A on immune cells mediate migration and the expression of IL-8 and CCL18 when stimulated by autoantibodies from systemic sclerosis patients

Jeannine Günther et al. Arthritis Res Ther. .

Abstract

Introduction: Agonistic autoantibodies (Aabs) against the angiotensin II receptor type 1 (AT1R) and the endothelin receptor type A (ETAR) have been identified in patients with systemic sclerosis (SSc). In our present study, we examined the expression of the AT1R and the ETAR in human immune cells and the pathological effects mediated through these receptors by their corresponding Aabs.

Methods: Protein expression of AT1R and ETAR on peripheral blood mononuclear cells (PBMCs) from healthy individuals and SSc patients was analyzed using flow cytometry, and mRNA expression of both receptors in PBMCs from healthy donors was examined by real-time PCR. In addition, PBMCs from healthy donors were stimulated in vitro with affinity-purified immunoglobulin G (IgG) fractions from SSc patients positive for AT1R and ETAR Aabs, as well as with IgG from healthy donors serving as controls. Alterations in cell surface marker expression, cytokine secretion and chemotactic motility were analyzed using flow cytometry, enzyme-linked immunosorbent assays and chemotaxis assays, respectively. The results were correlated with the characteristics and clinical findings of the IgG donors.

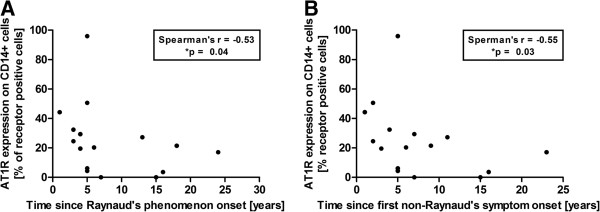
Results: Both AT1R and ETAR were expressed on PBMCs in humans. Protein expression of both receptors was decreased in SSc patients compared with that of healthy donors and declined during the course of disease. IgG fractions of SSc patients positive for AT1R and ETAR Aabs induced T-cell migration in an Aab level-dependent manner. Moreover, IgG of SSc patients stimulated PBMCs to produce more interleukin 8 (IL-8) and chemokine (C-C motif) ligand 18 (CCL18) than did the IgG of healthy donors. All effects were significantly reduced by selective AT1R and ETAR antagonists. Statistical analysis revealed an association of SSc-IgG induced high IL-8 concentrations with an early disease stage and of high CCL18 concentrations with lung fibrosis onset and vascular complications in the respective IgG donors.

Conclusion: In our present study, we could demonstrate the expression of both AT1R and ETAR on human peripheral T cells, B cells and monocytes. The decreased receptor expression in SSc patients, the inflammatory and profibrotic effects upon Aab stimulation of PBMCs in vitro and the associations with clinical findings suggest a role for Aab-induced activation of immune cells mediated by the AT1R and the ETAR in the pathogenesis or even the onset of the disease.


Figures

Figure 1
Figure 1
Angiotensin II receptor type 1 and endothelin receptor type A are expressed in human peripheral blood mononuclear cells, their protein expression is decreased in systemic sclerosis patients. Protein expression of both receptors in CD3+ T cells, CD19+ B cells and CD14+ monocytes of systemic sclerosis (SSc) patients (n = 18) and healthy donors (n = 14) was measured by flow cytometry. (A) Density of angiotensin II receptor type 1 (AT1R) and endothelin receptor type A (ETAR) (B) is represented by the median fluorescence intensity (MFI) normalized to the isotype control. (C) Frequency of AT1R-positive cells and (D)  ETAR-positive cells is represented by the percentage relative to an isotype control. (E) AT1R mRNA (AGTR1) expression and (F) ETAR mRNA (ENDRA) expression in CD3+ T cells, CD19+ B cells and CD14+ monocytes of healthy donors (n = 3) was measured by real-time PCR and calculated using the 2-ΔCt method. Results are represented relative to the housekeeping gene elongation factor 1 α1 (EF1A1). Statistical analysis was carried out by Mann–Whitney U test. Data are shown as box-and-whisker plots (Tukey). *P < 0.05 and **P < 0.01.
Figure 2
Figure 2
Angiotensin II receptor type 1 protein expression in monocytes of systemic sclerosis patients correlates negatively with disease duration. Frequency of angiotensin II receptor type 1 (AT1R)-positive CD14+ monocytes shows a significant negative correlation with (A) the time since onset of Raynaud’s phenomenon (patients with reported onset of Raynaud’s phenomenon; n = 16) and (B) the time since onset of the first non-Raynaud’s symptom presenting the onset of the disease (patients with reported onset of the first non-Raynaud’s symptom; n = 16). Statistical analysis was done by Spearman’s correlation. *P < 0.05.
Figure 3
Figure 3
Chemotaxis of T cells induced by immunoglobulin G from systemic sclerosis patients is reduced by receptor antagonists and depends on autoantibody levels. (A) Number of T cells that migrated toward medium control (contr.), immunoglobulin G of healthy donors (HD-IgG) and systemic sclerosis patients (SSc-IgG). Chemotaxis induced by SSc-IgG was significantly reduced by the angiotensin II receptor type 1 (AT1R) antagonist valsartan (Val) and the endothelin receptor type A (ETAR) antagonist sitaxsentan (Sit). Chemotaxis induced by HD-IgG was not significantly reduced (n.s.). (B) Numbers of T cells that migrated toward SSc-IgG correlate with anti-AT1R Aab levels of the SSc-IgG fractions used. (C) Numbers of T cells that migrated toward SSc-IgG correlate with anti-ETAR Aab levels of the SSc-IgG fractions used. Data are derived from five independent migration assays done with a total of 13 SSc-IgG and 10 HD-IgG. Statistical analysis was done by Mann–Whitney U test (control vs. HD-IgG, control vs. SSc-IgG and HD-IgG vs. SSc-IgG), Wilcoxon matched-pairs test (IgG vs. IgG with antagonist) and Spearman's correlation (B and C). Mean +/- SEM are shown in (A). *P < 0.05.
Figure 4
Figure 4
Immunoglobulin G of systemic sclerosis patients changed expression of markers on peripheral blood mononuclear cells and secretion of cytokines. Peripheral blood mononuclear cells (PBMCs) from healthy donors (HD) were stimulated for 8 to 20 hours in vitro by either immunoglobulin (IgG) from healthy donors (HD-IgG) or systemic sclerosis (SSc) patients (SSc-IgG). Protein expression of cell surface markers (A) CD14 and (B) CD16 were measured on monocytes by flow cytometry, density is represented by the median fluorescence intensity (MFI). (C) The soluble protein CD14 (sCD14), as well as the cytokines (D) interleukin 8 (IL-8) and (E) chemokine (C-C motif) ligand 18 (CCL18), were measured in the supernatants by enzyme-linked immunosorbent assay. Data derived from three independent experiments done with a total of five HD-IgG and ten SSc-IgG normalized to the unstimulated control. Statistical analysis was done by Mann–Whitney U test. Data are shown as box-and-whisker plots (Tukey). +P < 0.1, *P < 0.05 and **P < 0.01.
Figure 5
Figure 5
Receptor antagonists reduced interleukin 8 and chemokine (C-C motif) ligand 18 secretion, inhibiting effects are not additive. (A) Interleukin 8 (IL-8) and (B) chemokine (C-C motif) ligand 18 (CCL18) concentrations in the supernatants of peripheral blood mononuclear cells (PBMCs) from healthy donors after 8 hours of in vitro stimulation by immunoglobulin G of systemic sclerosis patients (SSc-IgG) after pretreatment with either the angiotensin II receptor type 1 blocker valsartan (Val) or the endothelin receptor type A blocker sitaxsentan (Sit), measured by enzyme-linked immunosorbent assay (ELISA) and normalized to the corresponding sample without any antagonist representing 100%. Data are derived from one experiment done with 26 SSc-IgG. Simultaneous blocking with both antagonists did not improve the inhibiting effects: (C) IL-8 and (D) CCL18 concentrations in the supernatants of PBMCs from three healthy donors after 8 hours of in vitro stimulation by SSc-IgG after pretreatment with valsartan (Val) or sitaxsentan (Sit) or both (Val + Sit) measured by ELISA and normalized to the corresponding samples without any antagonist representing 100%. Data derived from three independent experiments done with pooled IgG from thirteen SSc patients. Statistical analysis was done by Wilcoxon matched-pairs test. Medians (A and B) and medians with range (C and D) are shown. ***P < 0.001.
Figure 6
Figure 6
Interleukin 8 concentrations induced by immunoglobulin G of systemic sclerosis patients (SSc-IgG) in supernatants correlate with clinical features of SSc-IgG donors. (A) Correlation of measured interleukin 8 (IL-8) concentrations with the time since Raynaud’s phenomenon onset (26 patients with reported Raynaud’s phenomenon onset) and (B) classification into early and late stages of the disease (0 to 6 years and >6 years since systemic sclerosis (SSc) onset, respectively) by means of the first non-Raynaud’s symptom onset (25 patients with reported first non-Raynaud’s symptom onset). (C) Correlation of measured IL-8 concentrations with the time since onset of pulmonary arterial hypertension (PAH; 10 patients with reported PAH onset) and (D) with the diffusion capacity of the lung for carbon monoxide (DLCO; 23 patients with reported DLCO). IL-8 levels were measured by enzyme-linked immunosorbent assay. Statistical analysis was done by two-tailed Spearman's correlation (A, B and D) and by Mann–Whitney U test (B). Data in (B) are shown as box-and-whisker plot (Tukey). *P < 0.05, **P < 0.01.
Figure 7
Figure 7
Chemokine (C-C motif) ligand 18 concentrations induced by immunoglobulin G of systemic sclerosis patients (SSc-IgG) in supernatants correlate with clinical features of SSc-IgG donors. (A) Correlation of measured chemokine (C-C motif) ligand 18 (CCL18) concentrations with the time since lung fibrosis onset (13 patients with reported lung fibrosis onset). (B) Association of measured CCL18 concentrations in supernatants with the incidence of vascular complications (25 patients with reported vascular status). CCL18 concentrations were measured by enzyme-linked immunosorbent assay. Statistical analyses were done by two-tailed Spearman's correlation (A) and Mann–Whitney U test (B). Data in (B) are shown as box-and-whisker plot (Tukey’s test). *P < 0.05.

References

    1. Sakkas LI, Chikanza IC, Platsoucas CD. Mechanisms of disease: the role of immune cells in the pathogenesis of systemic sclerosis. Nat Clin Pract Rheumatol. 2006;2:679–685. - PubMed
    1. Riemekasten G, Philippe A, Näther M, Slowinski T, Müller DN, Heidecke H, Matucci-Cerinic M, Czirják L, Lukitsch I, Becker M, Kill A, van Laar JM, Catar R, Luft FC, Burmester GR, Hegner B, Dragun D. Involvement of functional autoantibodies against vascular receptors in systemic sclerosis. Ann Rheum Dis. 2011;70:530–536. doi: 10.1136/ard.2010.135772. - DOI - PubMed
    1. Sakkas LI, Platsoucas CD. Is systemic sclerosis an antigen-driven T cell disease? Arthritis Rheum. 2004;50:1721–1733. doi: 10.1002/art.20315. - DOI - PubMed
    1. Abraham DJ, Varga J. Scleroderma: from cell and molecular mechanisms to disease models. Trends Immunol. 2005;26:587–595. doi: 10.1016/j.it.2005.09.004. - DOI - PubMed
    1. Prescott RJ, Freemont AJ, Jones CJ, Hoyland J, Fielding P. Sequential dermal microvascular and perivascular changes in the development of scleroderma. J Pathol. 1992;166:255–263. doi: 10.1002/path.1711660307. - DOI - PubMed

Publication types

MeSH terms