. 2014 Mar 17;24(6):598-608.
doi: 10.1016/j.cub.2014.01.071. Epub 2014 Mar 6.

Identification of transcriptional and metabolic programs related to mammalian cell size

Affiliations

Identification of transcriptional and metabolic programs related to mammalian cell size

Teemu P Miettinen et al. Curr Biol. .

Abstract

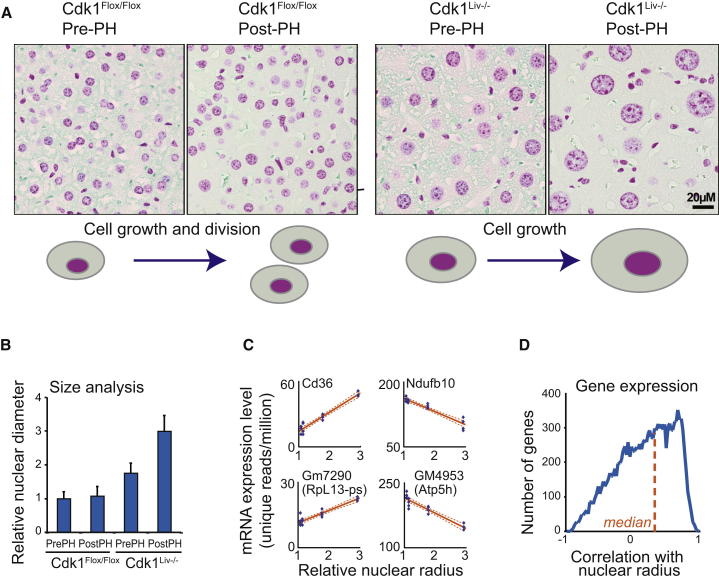
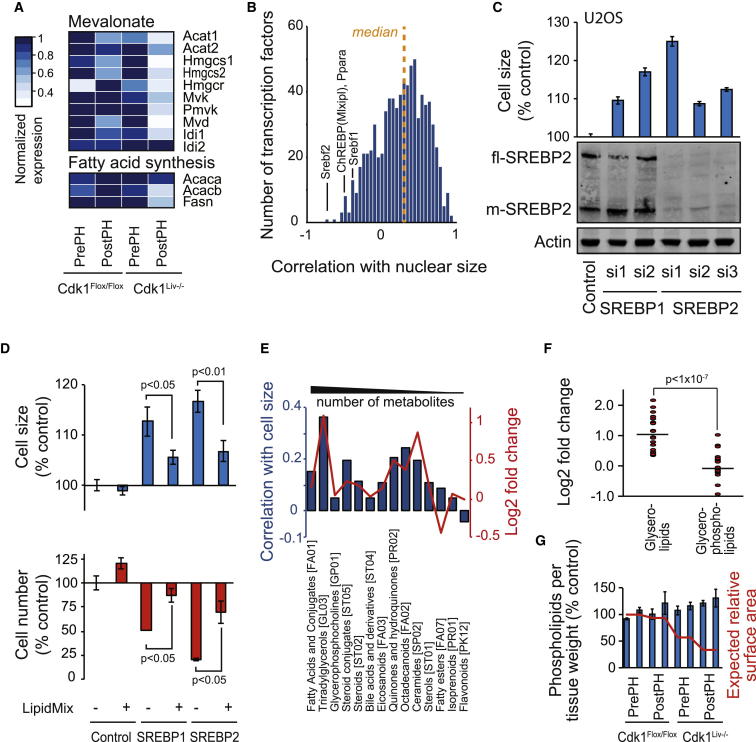
Background: Regulation of cell size requires coordination of growth and proliferation. Conditional loss of cyclin-dependent kinase 1 in mice permits hepatocyte growth without cell division, allowing us to study cell size in vivo using transcriptomics and metabolomics.

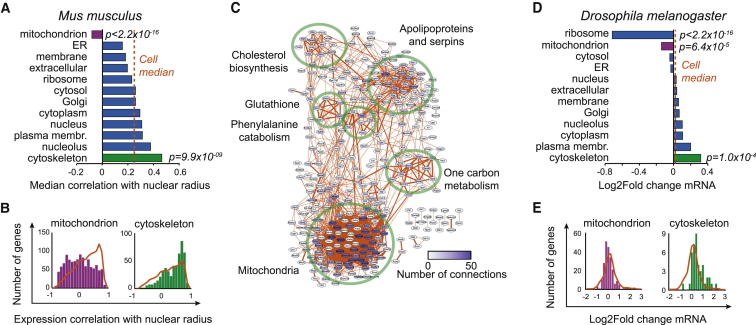
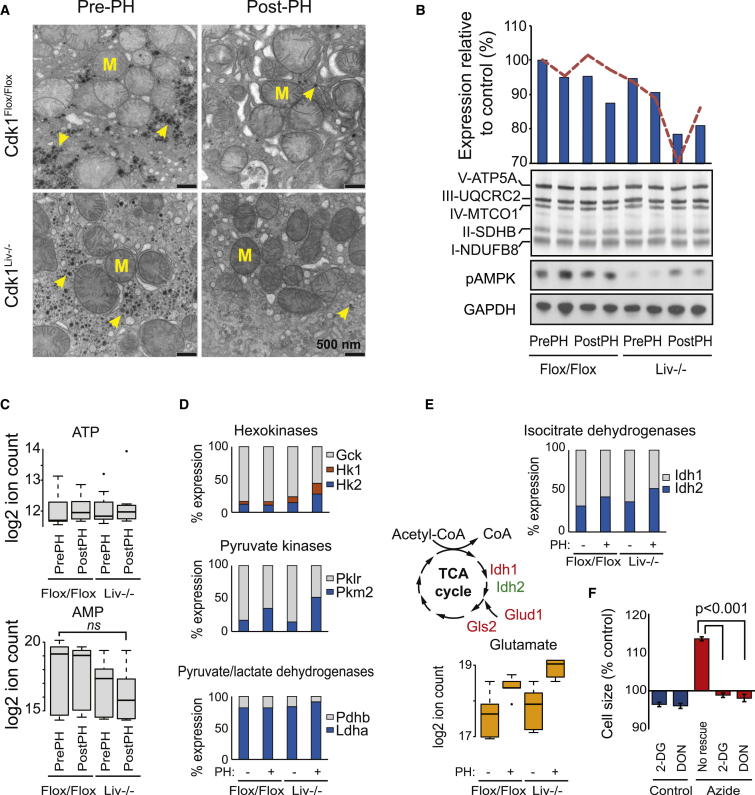
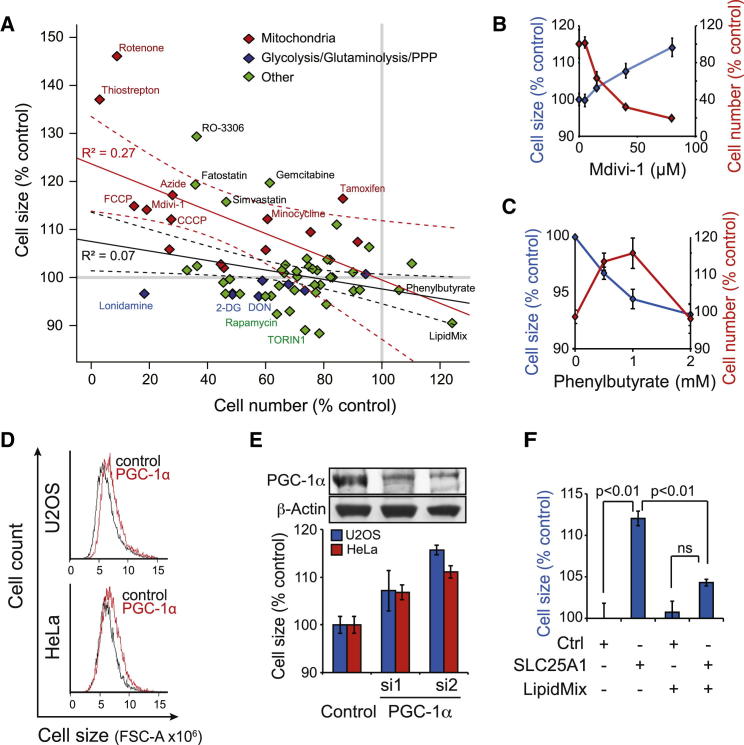
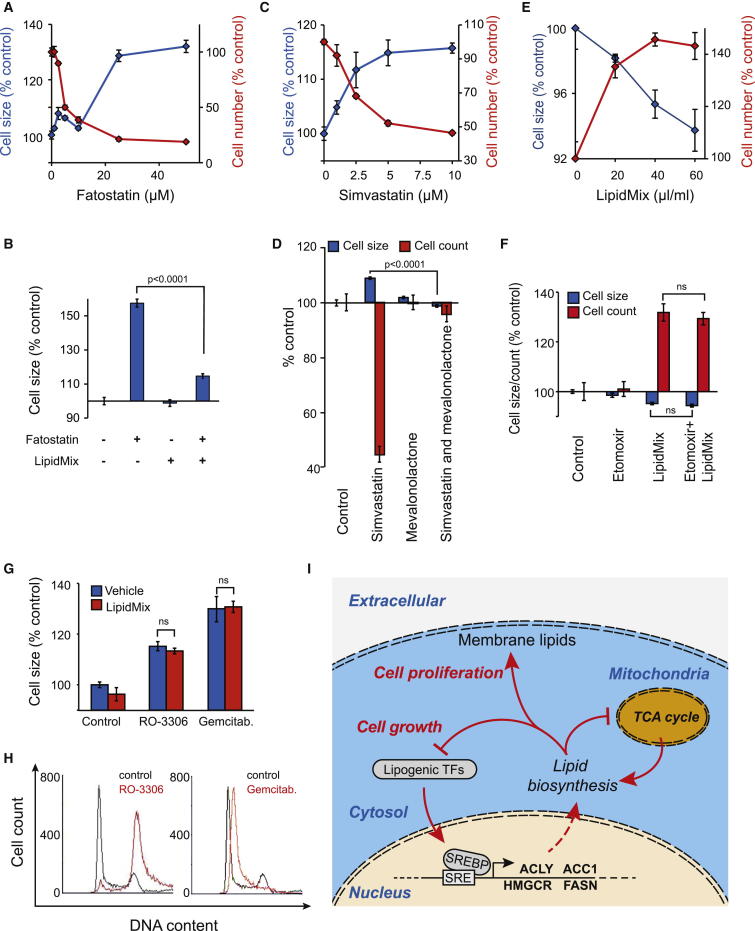
Results: Larger cells displayed increased expression of cytoskeletal genes but unexpectedly repressed expression of many genes involved in mitochondrial functions. This effect appears to be cell autonomous because cultured Drosophila cells induced to increase cell size displayed a similar gene-expression pattern. Larger hepatocytes also displayed a reduction in the expression of lipogenic transcription factors, especially sterol-regulatory element binding proteins. Inhibition of mitochondrial functions and lipid biosynthesis, which is dependent on mitochondrial metabolism, increased the cell size with reciprocal effects on cell proliferation in several cell lines.

Conclusions: We uncover that large cell-size increase is accompanied by downregulation of mitochondrial gene expression, similar to that observed in diabetic individuals. Mitochondrial metabolism and lipid synthesis are used to couple cell size and cell proliferation. This regulatory mechanism may provide a possible mechanism for sensing metazoan cell size.


Figures

Figure 1
Figure 1
Correlation of Gene-Expression and Metabolite Levels with Cell Size in Mouse Liver (A) Representative Feulgen-stained histological sections of Cdk1Flox/Flox and Cdk1Liv−/− liver before and 96 hr after PH. The Cdk1Liv−/− hepatocytes regenerate by growing in size because they are unable to divide, whereas the cell size in Cdk1Flox/Flox liver is not significantly changed. All images were taken with the same magnification. Scale bar represents 20 μm. (B) Quantification of the nuclear sizes in liver samples. The data shown indicate mean ± SD of nuclear radius relative to control Cdk1Flox/Flox before PH (n = 13–55 cells). (C) Analysis of gene expression by RNA-seq. Four genes displaying strong correlation with nuclear radius are shown as examples with correlation, and ±90% confidence intervals are shown with solid and dotted line, respectively. (D) A density plot of gene-expression correlations with nuclear radius for all genes. Median Pearson correlation (0.222) for all genes is indicated with the dotted line. See also Figure S1 and Tables S1 and S2.
Figure 2
Figure 2
Correlation of Gene Expression with Cell Size for Different Subcellular Components Identifies Downregulation of Mitochondrial Genes (A) Mouse genes annotated to individual subcellular components using gene ontology (GO) analysis were identified, and median correlation with nuclear size was calculated. Dotted orange line indicates median cell correlation for all genes included in this analysis. We calculated p values using Kolmogorov-Smirnov test. (B) Expression correlations for genes annotated to mitochondria and cytoskeleton. Correlations were binned to obtain scaling profiles (bars) for each subcellular component. For comparison, the whole-cell profile (only genes with annotation in any of the subcellular component analyses, as opposed to all genes in Figure 1D, orange line) is overlaid on the bar chart. The number of genes in the whole-cell profile was normalized to the number of genes in individual subcellular components to simplify comparison. (C) Connectivity of genes correlating negatively (adjusted p value < 0.05) with cell size, as identified using the STRING database. Groups of functionally interacting genes are indicated with green circles and named. Note that one-carbon metabolism genes, such as adenosylhomocysteinase (Ahcy), are important for glutathione synthesis, indicating possible coregulation. (D) Drosophila genes annotated to individual subcellular components as for liver data. Dotted orange line indicates median of log2 fold change for all genes included in this analysis. (E) Histograms of mitochondrial and cytoskeletal gene expression compared to all genes (orange line) in Drosophila Kc167 cells. See also Figure S2 and Tables S3 and S4.
Figure 3
Figure 3
Glycolysis Increases with Cell Size (A) Representative electron microscopy images of Cdk1Flox/Flox and Cdk1Liv−/− liver before and after hepatectomy. Arrows and “M” indicate glycogen and mitochondria, respectively. All scale bars represent 500 nm. For quantification, see Figure S3A. (B) mRNA expression (red line) and protein levels (blue bars) of selected OxPhos proteins. Western blot shows the measured OxPhos complex components, phospho-Thr172-AMPK (pAMPK) levels, and GAPDH (loading control). (C) Relative ATP and AMP levels in liver samples, as measured by mass spectrometry. Statistical significance was measured by ANOVA. (D) Proportional expression of key glycolytic genes based on liver RNA-seq data. (E) Glutamate metabolite levels (orange) and Idh expression levels (blue and gray) correlate with cell size. (F) Inhibition of glycolysis and glutaminolysis by 2-DG and DON rescue U2OS cell size increase by 1 mM sodium azide (p < 0.001 in both; t test, mean ± SD, n = 3). See also Figure S3.
Figure 4
Figure 4
Inhibition of Mitochondrial Functions Increases Cell Size in Cultured Cells (A) Changes in cell size and cell number in U2OS cells by small molecules. Compounds with known effects on mitochondria are displayed in red. Glycolysis, glutaminolysis, and PPP compounds are displayed in blue, and others are displayed in green. Red and black solid lines display linear regression for mitochondria targeting and for all other compounds, respectively, with 90% confidence intervals shown as dotted line. See Table S5 for all compounds and concentrations used. (B) U2OS cell number (red line) and cell size (blue line) were analyzed as a function of Mdivi-1 concentration (n = 3, 48 hr). (C) HeLa cell number (red line) and cell size (blue line) as a function of phenylbutyrate concentration in delipidated FBS (n = 3, 48 hr). (D) Representative cell-size profiles for PGC-1α knockdown in U2OS and HeLa cells. (E) Quantification of cell-size changes by two PGC-1α targeting siRNAs (25 nM) compared to control RNAi-treated cells (n = 3, 48 hr), with a western blot showing the knockdown efficiency in U2OS cells. All treatments except siRNA1 in U2OS cells had p value < 0.01 (t test). (F) Rescue of SLC25A1 RNAi (15 nM) by LipidMix (50 μl/ml) (n = 3, 48 hr). Data shown indicate mean ± SD with t test (ns, not significant). See also Figure S4 and Table S5.
Figure 5
Figure 5
SREBP-Mediated Lipid Biosynthesis Is Involved in Modulation of Cell Size (A) Relative expression of genes in the mevalonate and cholesterol synthesis pathway and fatty acid synthesis pathway decreases with cell size in mouse liver. The expression values were normalized to the highest expression for each gene. (B) Histogram of individual transcription factor expression correlation with cell size in mouse liver. Median correlation of all transcription factors (r = 0.275) is indicated with the dotted line. (C) Quantification of U2OS cell-size changes by targeting SREBP1 and SREBP2 with nonoverlapping siRNAs (25 nM, n = 3, 60 hr). Knockdown of SREBP2 was validated by western blotting. β-actin was used as loading control. Compared to control, p value < 0.001 with all SREBP siRNAs (t test). (D) Rescue of cell size by SREBP RNAi using LipidMix in U2OS cells. Significance was analyzed by t test (n = 3, 55 hr). (E) Correlations (blue bars) and log2 fold changes (red line) for all lipid classes containing more than four metabolites, as classified in LIPID MAPS (http://www.lipidmaps.org). (F) Log2 fold changes between smallest and largest liver cells for individual glycerolipids and glycerophospholipids based on the metabolomics measurement. Horizontal line indicates mean (t test). (G) Measurement of total phospholipids using a colorimetric assay from liver extracts. Phospholipids were normalized to tissue weight. Expected cell-surface area relative to volume is in red. The differences in phospholipid levels are significant (p < 0.01, ANOVA). Data shown in (C), (D), and (G) indicate mean ± SD (n = 3). See also Figure S5.
Figure 6
Figure 6
Lipids Modulate Cell Size and Proliferation Ratio (A) Cell number (red line) and cell size (blue line) were measured after 48 hr (n = 3). (B) Fatostatin (25 μM) effects on U2OS cell size were rescued by 50 μl/ml LipidMix (n = 3, 64 hr, t test). (C) U2OS cell number (red line) and cell size (blue line) were analyzed as a function of simvastatin concentration (n = 3, 48 hr). (D) Simvastatin (7.5 μM) effects on U2OS cell size and cell proliferation were rescued by 5 mM mevalonolactone (n = 3, 60 hr, t test). (E) Dose dependence of increased HeLa cell proliferation by LipidMix in delipidated FBS-containing medium (n = 3, 48 hr). (F) Effect of etomoxir (50 μM) on LipidMix induced HeLa cell proliferation in 10% lipid-free FBS (n = 3, 60 hr, t test). (G) Effect of LipidMix (50 μl/ml) on cell size in U2OS cells arrested with 7.5 μM RO-3306 or 1 μM Gemcitabine (n = 3, 34 hr). Data shown in (A)–(G) indicate mean ± SD. (H) Cell-cycle arrests in G2/M and early S phase by RO-3306 and Gemcitabine, respectively, were verified by DNA staining. (I) When cells proliferate, high mitochondrial metabolic activity and lipogenic transcription-factor levels are maintained. When cell size increases, the relative need for plasma membrane lipids decreases. Intracellularly accumulating lipids repress the activity of lipogenic transcription factors and, consequently, lipid synthesis-related gene expression. Downregulated lipid biosynthesis, in turn, reduces the need for mitochondrial metabolism. Similarly, if mitochondria are inhibited, proliferation is reduced without directly inhibiting cell growth. SREBP is shown as an example; SRE is sterol-regulatory element DNA motif. See also Figure S6.

Comment in

References

    1. Lloyd A.C. The regulation of cell size. Cell. 2013;154:1194–1205. - PubMed
    1. Jorgensen P., Tyers M. How cells coordinate growth and division. Curr. Biol. 2004;14:R1014–R1027. - PubMed
    1. Marguerat S., Bähler J. Coordinating genome expression with cell size. Trends Genet. 2012;28:560–565. - PubMed
    1. Turner J.J., Ewald J.C., Skotheim J.M. Cell size control in yeast. Curr. Biol. 2012;22:R350–R359. - PMC - PubMed
    1. Jorgensen P., Nishikawa J.L., Breitkreutz B.J., Tyers M. Systematic identification of pathways that couple cell growth and division in yeast. Science. 2002;297:395–400. - PubMed

Publication types

LinkOut - more resources