. 2014 Mar 27;6(6):1046-1058.
doi: 10.1016/j.celrep.2014.02.013. Epub 2014 Mar 6.

De novo formation of insulin-producing "neo-β cell islets" from intestinal crypts

Affiliations

De novo formation of insulin-producing "neo-β cell islets" from intestinal crypts

Yi-Ju Chen et al. Cell Rep. .

Abstract

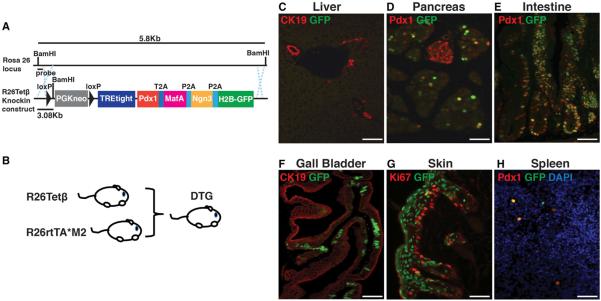
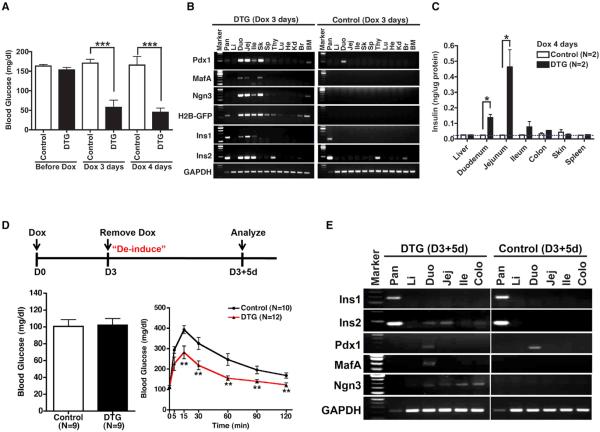
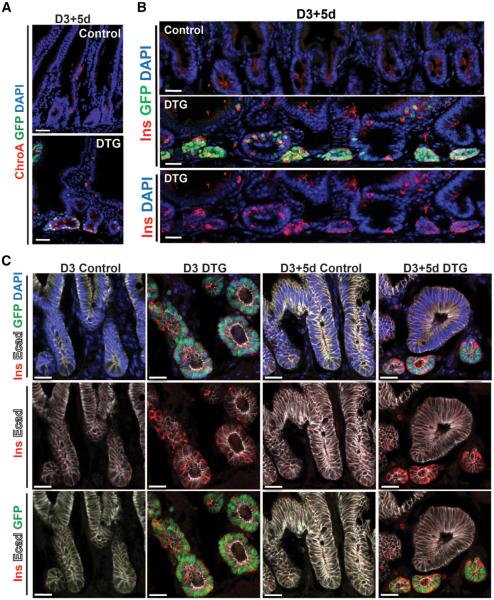
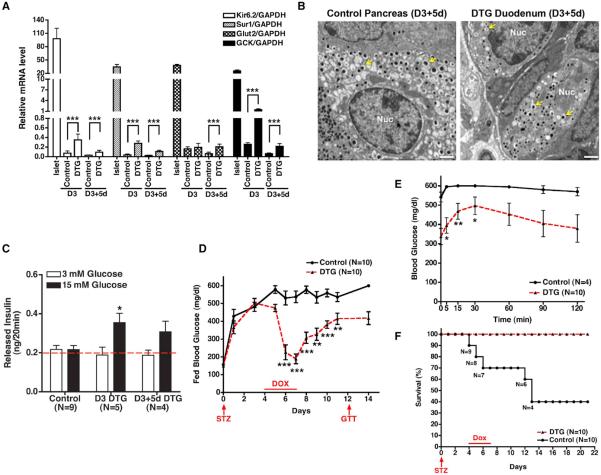
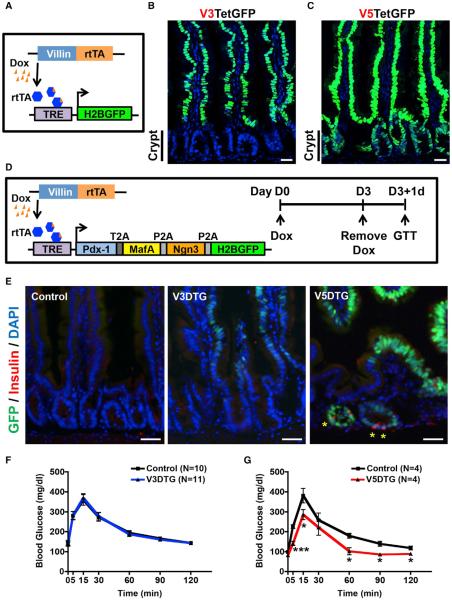
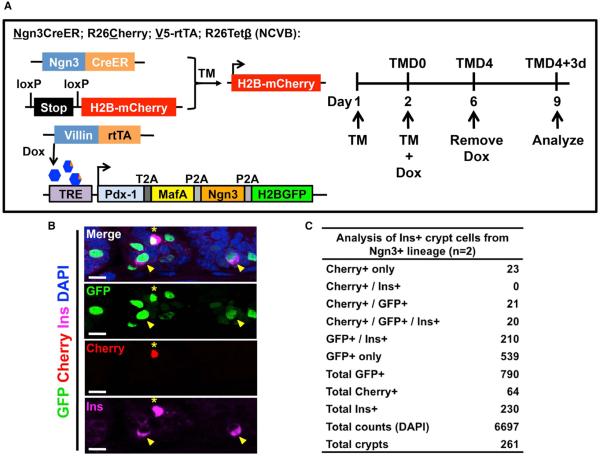
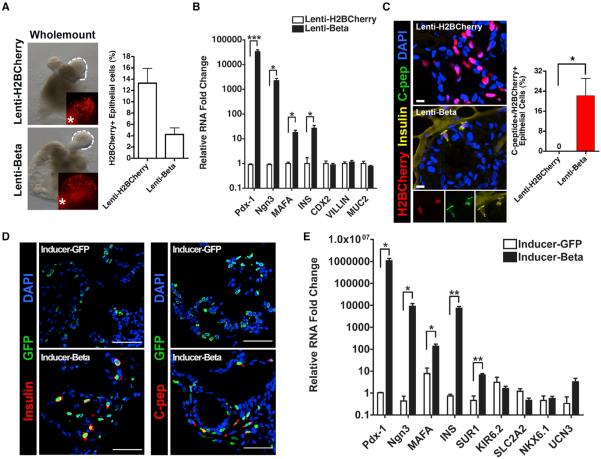
The ability to interconvert terminally differentiated cells could serve as a powerful tool for cell-based treatment of degenerative diseases, including diabetes mellitus. To determine which, if any, adult tissues are competent to activate an islet β cell program, we performed an in vivo screen by expressing three β cell "reprogramming factors" in a wide spectrum of tissues. We report that transient intestinal expression of these factors-Pdx1, MafA, and Ngn3 (PMN)-promotes rapid conversion of intestinal crypt cells into endocrine cells, which coalesce into "neoislets" below the crypt base. Neoislet cells express insulin and show ultrastructural features of β cells. Importantly, intestinal neoislets are glucose-responsive and able to ameliorate hyperglycemia in diabetic mice. Moreover, PMN expression in human intestinal "organoids" stimulates the conversion of intestinal epithelial cells into β-like cells. Our results thus demonstrate that the intestine is an accessible and abundant source of functional insulin-producing cells.


Figures

Figure 1
Figure 1. An In Vivo Screen for Tissues Competent to Initiate Insulin Transcription
(A) Schematic representation of transgenes used to generate Dox-inducible Tetß mice. A cassette containing Pdx1, MafA, Ngn3, and H2B-GFP cDNAs linked by 2A peptide sequences (T2A, P2A) under the tetracycline-responsive promoter (TRE-tight) was targeted into the Rosa26 locus, resulting in the R26Tetß-targeting construct. (B) Schematic showing breeding of R26Tetß and R26rtTA*M2 mice to generate double-transgenic (DTG) mice. Mice bearing either the R26Tetß or R26rtTA*M2 transgene served as controls. (C–H) GFP induction in DTG tissues after 4 days of Dox treatment. Immunofluorescence images showing GFP and costaining with the indicated markers. GFP was detected by direct epifluorescence. Note the absence of GFP in the liver (C) and pancreatic islets (D). Coexpression of GFP and Pdx1 is shown in pancreatic acinar cells (D), intestinal epithelial cells (E), and spleen cells (H). The scale bars represent 25 μm. See also Figure S1.
Figure 2
Figure 2. Systemic Effects of Intestinal Insulin following PMN Expression
(A) Blood glucose levels of DTG mice following 3 to 4 days Dox treatment (measured after 1 hr fast). ***p < 0.001, Student's t test. (B) RT-PCR analysis in multiple tissues from DTG mice and controls treated with 3 days Dox. GAPDH served as a control for template cDNA. BM, bone marrow; Br, brain; Duo, duodenum; He, heart; Ile, ileum; Jej, jejunum; Kd, kidney; Li, liver; Lu, lung; Pan, pancreas; Sk, skin; Sp, spleen; Thy, thymus. (C) Measurement of insulin protein in various tissues by ELISA. *p < 0.05, Student's t test. (D) Top: Schematic for induction of PMN factors for 3 days with Dox and then “deinduction” for 5 days following Dox removal. Lower left: D3+5d animals have normal fasting blood glucose (17 hr fast). Lower right: D3+5d animals have improved glucose homeostasis following intraperitoneal glucose challenge. **p < 0.01, Student's t test. (E) RT-PCR analysis of insulin (Ins1 and Ins2), Pdx1, MafA, and Ngn3 transcript abundance in multiple tissues from D3+5d deinduced mice. See also Figure S2.
Figure 3
Figure 3. Intestinal Insulin+ Cells Are Epithelially Derived and Form Neoislets
(A and B) Representative immunofluorescence images of D3+5d DTG intestines stained for ChroA (A) and insulin (B). H2B-GFP marks “label-retaining” (nondividing) cells in the intestine in deinduced D3+5d mice. (C) Representative sections of D3 and D3+5d mice intestine stained for insulin (Ins), E-cadherin (Ecad), and DAPI. The scale bars represent 25 μm. See also Figure S3.
Figure 4
Figure 4. Physiological Features of Intestinal Insulin+ Cells
(A) Quantitative PCR analysis of the b cell transcripts Kir6.2, Sur1, Glut2, and glucokinase (GCK) in normal islets and crypts from control or DTG mice. Crypt cells were isolated from 20 cm segments of mouse small intestines as described in Experimental Procedures. ***p < 0.001, Student's t test. (B) Electron micrographs of a pancreatic b cell from a control mouse and an intestinal crypt cell from D3+5d DTG mouse. b-granules (yellow arrows) can be seen in both. Nuc, nucleus. (C) Glucose-stimulated insulin secretion from intestinal crypt cells. Crypts were isolated from control or DTG intestines as indicated. Insulin was measured by ELISA in the presence of 3 mM or 15 mM glucose for 20 min. The red dashed line (0.2 ng) reflects the background level of the assay (buffer alone). p = 0.0286 by one-way ANOVA between three groups (control, DTG 3 mM glucose, and DTG 15 mM glucose). *p < 0.05. (D) Blood glucose levels of control and DTG animals treated with streptozotocin (STZ) and Dox. Four days after STZ injection, mice were given Dox for 3 days. On day 12 (5 days after Dox withdrawal), mice were subjected to glucose-tolerance testing (GTT). *p < 0.05, **p < 0.01, ***p < 0.001, Student's t test. (E) Blood-glucose levels of control and DTG mice treated with STZ and Dox and challenged with an intraperitoneal injection of glucose (GTT) at day 12 (see D). (F) Kaplan-Meier analysis of control and DTG mice treated with STZ. p < 0.001 between groups. Data are presented as mean ± SD in (A) and mean ± SEM in (C)–(F). The scale bars represent 1 μm. See also Figure S4.
Figure 5
Figure 5. Intestinal Insulin+ Cells Are Derived from Crypts
(A) Schematic of Villin-rtTA transgene experiments. Different founder of Villin-rtTA mouse lines were bred with Tet-GFP mice to obtain V3TetGFP or V5TetGFP mice. (B) The V3-rtTA transgene drives GFP expression in villi, but not crypts, after Dox treatment. (C) The V5-rtTA transgene drives GFP expression throughout the crypt-villus axis after Dox treatment. (D) Schematic of experimental design. V3 and V5-rtTA mouse lines were bred to R26Tetß mice to generate V3DTG and V5DTG mice, respectively. V3DTG, V5DTG, and littermate control mice were given Dox for 3 days and then fasted for 17 hr prior to intraperitoneal (i.p.)-GTT assay. Intestinal tissues were collected after i.p.-GTT experiments.
Figure 6
Figure 6. Intestinal Insulin+ Cells Can Arise from Ngn3+ Cells
(A) Schematic of Ngn3-lineage-tracing experiment in insulin+ crypt cells. V5DTG mice were bred to Ngn3CreER and R26Cherry reporter mice to generate NCVB mice. Four- to five-week-old NCVB mice were injected twice with 8 mg tamoxifen (TM) to label the Ngn3+ cells. Mice were then given Dox-containing water for 4 days to induce intestinal PMN expression followed by 3 days of untreated water prior to analysis. (B) Representative IF images of NCVB intestines stained for insulin and DAPI. The asterisk indicates a GFP+/insulin+ cell that carries the mCherry Ngn3 lineage label, whereas arrowheads indicate GFP+/insulin+ cells that are negative for mCherry. The scale bars represent 10 μm. (C) Quantification of Ngn3-lineage-traced insulin+ crypt cells. See also Figure S5.
Figure 7
Figure 7. Insulin Production in Human Crypt Cells following PMN Expression
(A) Whole-mount bright field and immunofluorescence images from human intestinal crypt organoids (HIOs) infected with lenti-H2BCherry or lenti-beta virus. Infection rates were calculated by counting H2B-Cherry+ cells as a percentage of epithelial cells in the organoids. (B) Quantitative PCR analysis of HIOs after infection with lenti-H2BCherry or lenti-beta virus for the indicated transcripts compared to GAPDH control. Experiments were performed using biological triplicates (each biological group contained at least five organoids). *p < 0.05, Student's t test. (C) Immunofluorescence for H2BCherry, insulin, and C-peptide in lenti-H2BCherry- or lenti-beta-infected organoids. Insulin+/C-peptide+ cells were detected exclusively in lenti-beta-infected human crypt organoids and quantified (right). *p < 0.05, Student's t test. (D) Immunofluorescence for insulin and C-peptide in inducible HIOs. Inducible HIOs were generated from Inducer-GFP or Inducer-beta-virus-infected hESCs. Insulin and C-peptide signals were detected and colocalized with GFP+ cells in Inducer-beta HIOs. (E) Quantitative PCR analysis of inducible HIOs for the indicated transcripts compared to GAPDH control. Experiments were performed using biological triplicates (each biological group containing at least five organoids). *p < 0.05, **p < 0.01, Student's t test. Data are presented as mean ± SEM. The scale bar represents 10 μm (C) and 50 μm (D). See also Figure S6.

References

    1. Akinci E, Banga A, Greder LV, Dutton JR, Slack JM. Reprogramming of pancreatic exocrine cells towards a beta (β) cell character using Pdx1, Ngn3 and MafA. Biochem. J. 2012;442:539–550. - PMC - PubMed
    1. Akinci E, Banga A, Tungatt K, Segal J, Eberhard D, Dutton JR, Slack JM. Reprogramming of various cell types to a beta-like state by Pdx1, Ngn3 and MafA. PLoS ONE. 2013;8:e82424. - PMC - PubMed
    1. Apostolou E, Hochedlinger K. Chromatin dynamics during cellular reprogramming. Nature. 2013;502:462–471. - PMC - PubMed
    1. Buganim Y, Faddah DA, Jaenisch R. Mechanisms and models of somatic cell reprogramming. Nat. Rev. Genet. 2013;14:427–439. - PMC - PubMed
    1. Carey BW, Markoulaki S, Hanna JH, Faddah DA, Buganim Y, Kim J, Ganz K, Steine EJ, Cassady JP, Creyghton MP, et al. Reprogramming factor stoichiometry influences the epigenetic state and biological properties of induced pluripotent stem cells. Cell Stem Cell. 2011;9:588–598. - PubMed

Publication types